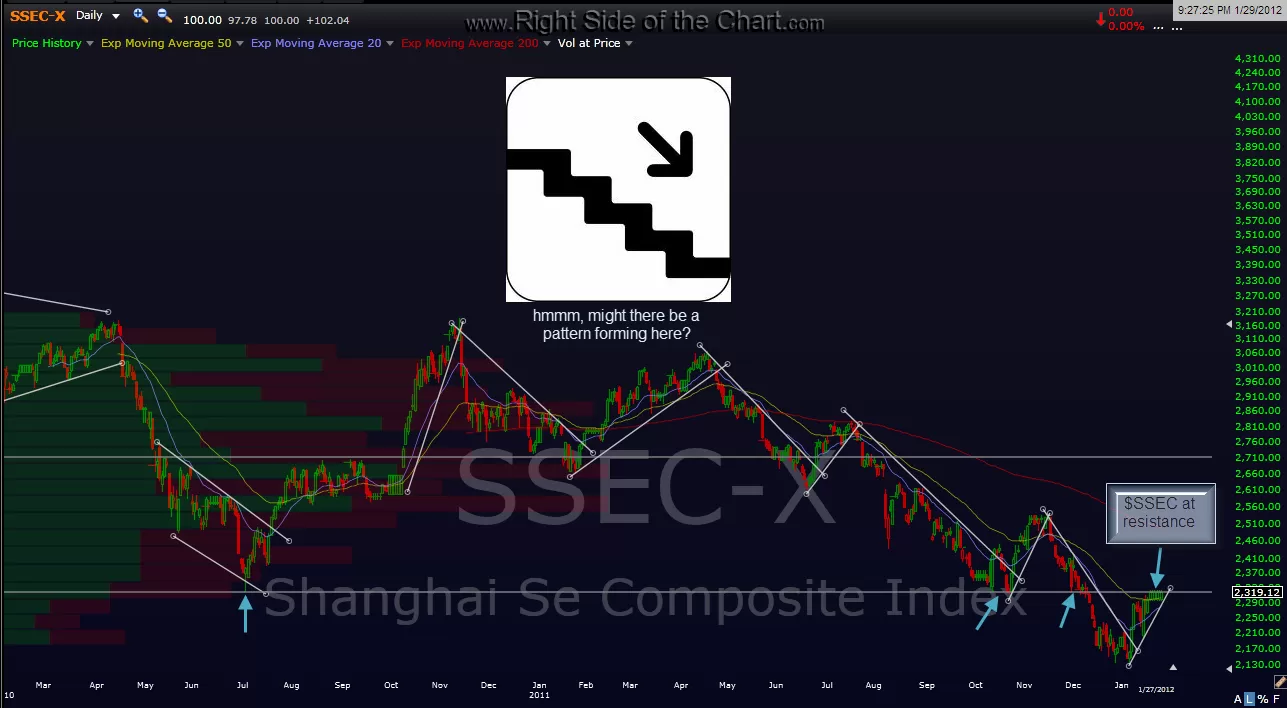
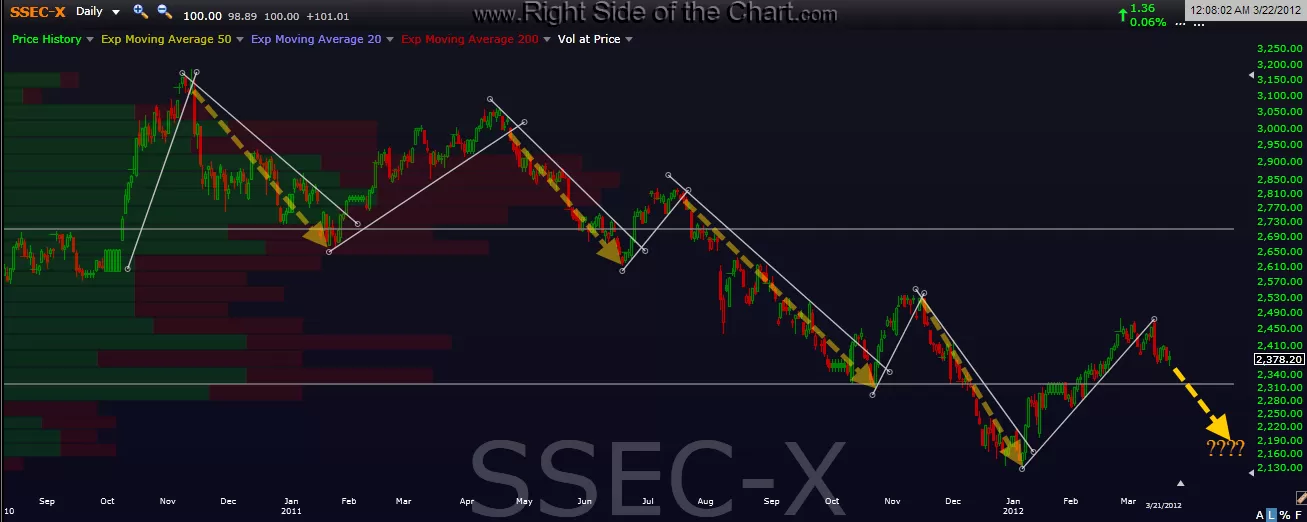
..well, it’s not exactly headed to Heaven. first chart was posted on january 29th, illustrating the clear stair-stepping pattern in the $SSEC (Shanghai Composite). as you can see, that uptrend line finally broke down on march 6th and made a perfect re-test on march 14th (confirming the price rejection off that re-test with that huge red candlestick).
so now what? will this pattern continue to repeat itself indefinitely? of course not. however, a trend is a trend, and a pattern is a pattern until proven otherwise. the orange dashed arrows on the current chart below show the point to point move lower on each previous uptrend line break. regardless of whether a short on china plays out to anywhere near those previous drops is yet to be seen but one thing is irrefutable when looking at this chart and that is the fact that china is solidly entrenched in a text-book downtrend (series of lower highs and lower lows). looking at the strength of the uber-gov’t manipulated US stock market since march ’09, it’s almost hard to believe that the current bear market in the SSEC began all the way back on august ’09 and the SSEC had dropped as much as 40% since then at it recent lows in january. all that and the SPX is currently up about 43% since that peak in the SSEC and the NDX up a whopping 75% since then.
print away, master ben, just keep printing forever and don’t ever stop the presses!! the rest of the world can crumble to pieces around the ol’ USA but as long as we just keep printing money and writing checks that we’ll never be able to cash and kicking the can down the road, everything will be hunky-dory.