
VTI (“THE” stock market*) has fallen to key uptrend line support & while a breakdown appears imminent, we could get one last hooray off this support before the trendline goes with conviction. Bounce or no bounce, a daily close below the trendline will trigger the next long-term sell signal. Daily chart below.
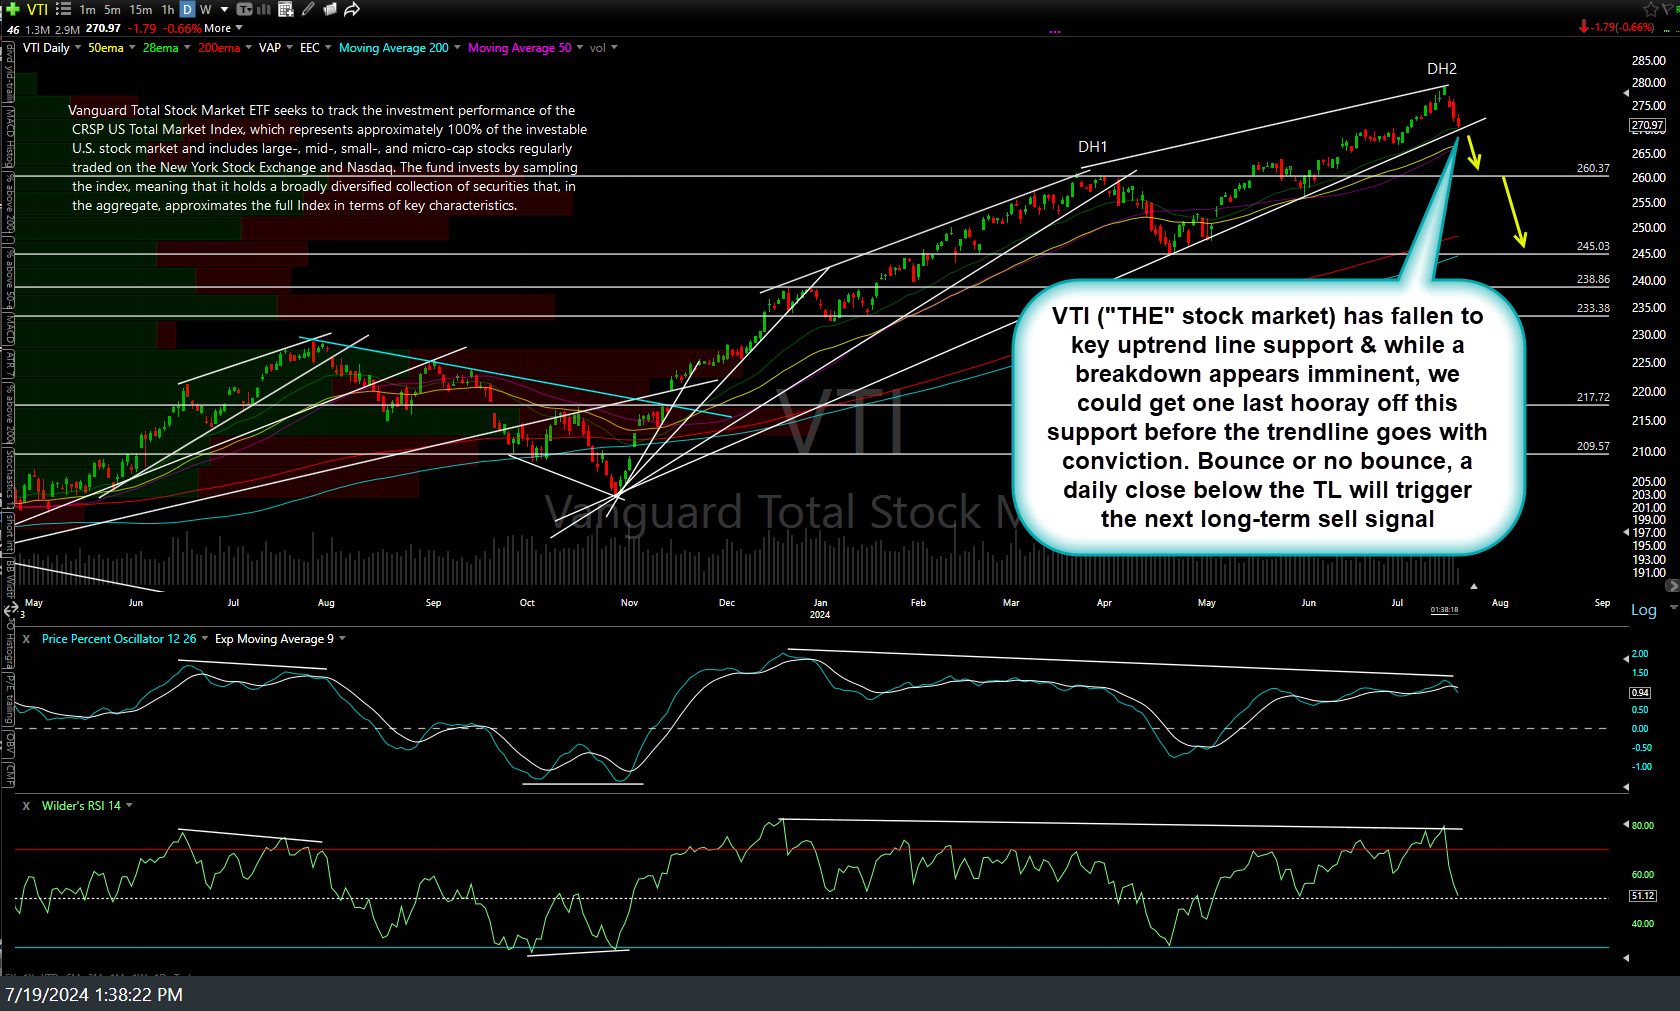
VTI daily July 19th
Likewise, SPY (S&P 500** ETF) has also just fallen to the key uptrend line off the Oct lows (support) with the next sell signal to come on a solid daily close below it.
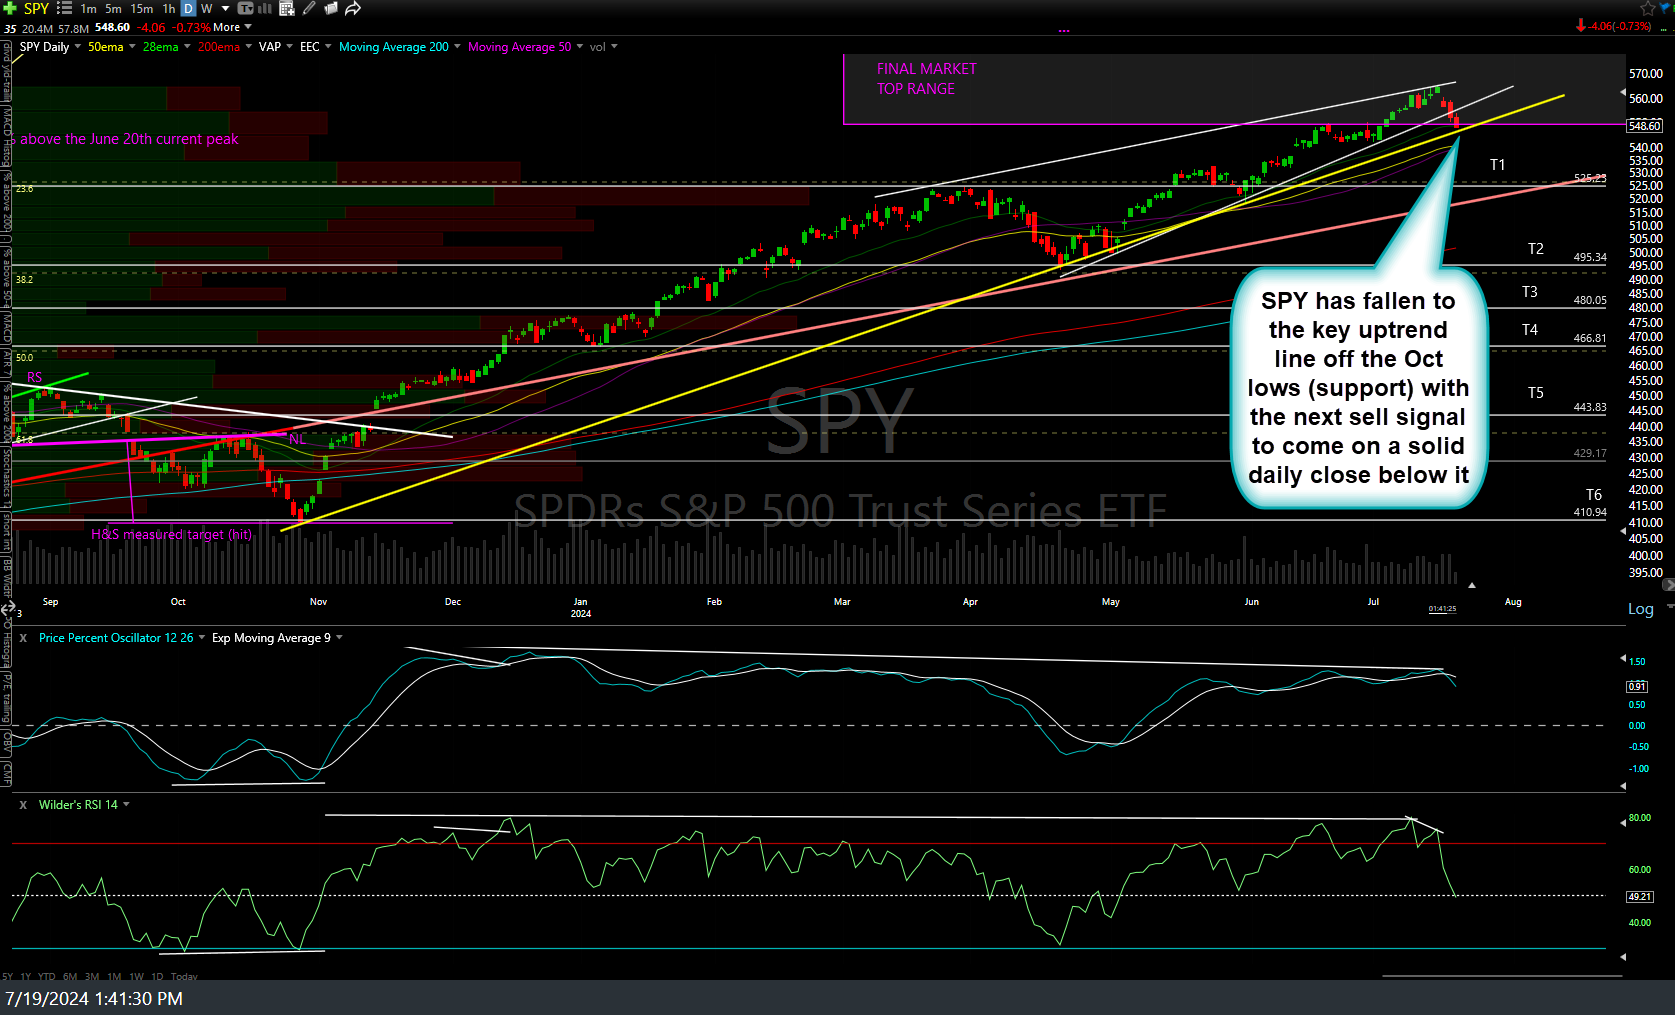
SPY daily July 19th
*Vanguard Total Stock Market ETF seeks to track the investment performance of the CRSP US Total Market Index, which represents approximately 100% of the investable U.S. stock market and includes large-, mid-, small-, and micro-cap stocks regularly traded on the New York Stock Exchange and Nasdaq. The fund invests by sampling the index, meaning that it holds a broadly diversified collection of securities that, in the aggregate, approximates the full Index in terms of key characteristics.
**The S&P 500 Index or Standard & Poor’s 500 Index is a market-capitalization-weighted index of 500 leading publicly traded companies in the U.S.