After waiting forever and a day for TC2000 to activate the link feature to share a live chart (which has been listed in the right-click options menu for years now but not functioning), I have given up and have begun the process of annotating certain key index charts on StockCharts.com in order to share some live links to these charts. I plan to continue to use TC2000 as my primary charting platform but figured that it might be beneficial to post live links on a few of the key US and international indices as well as certain breadth & sentiment indicators as well as select commodities.
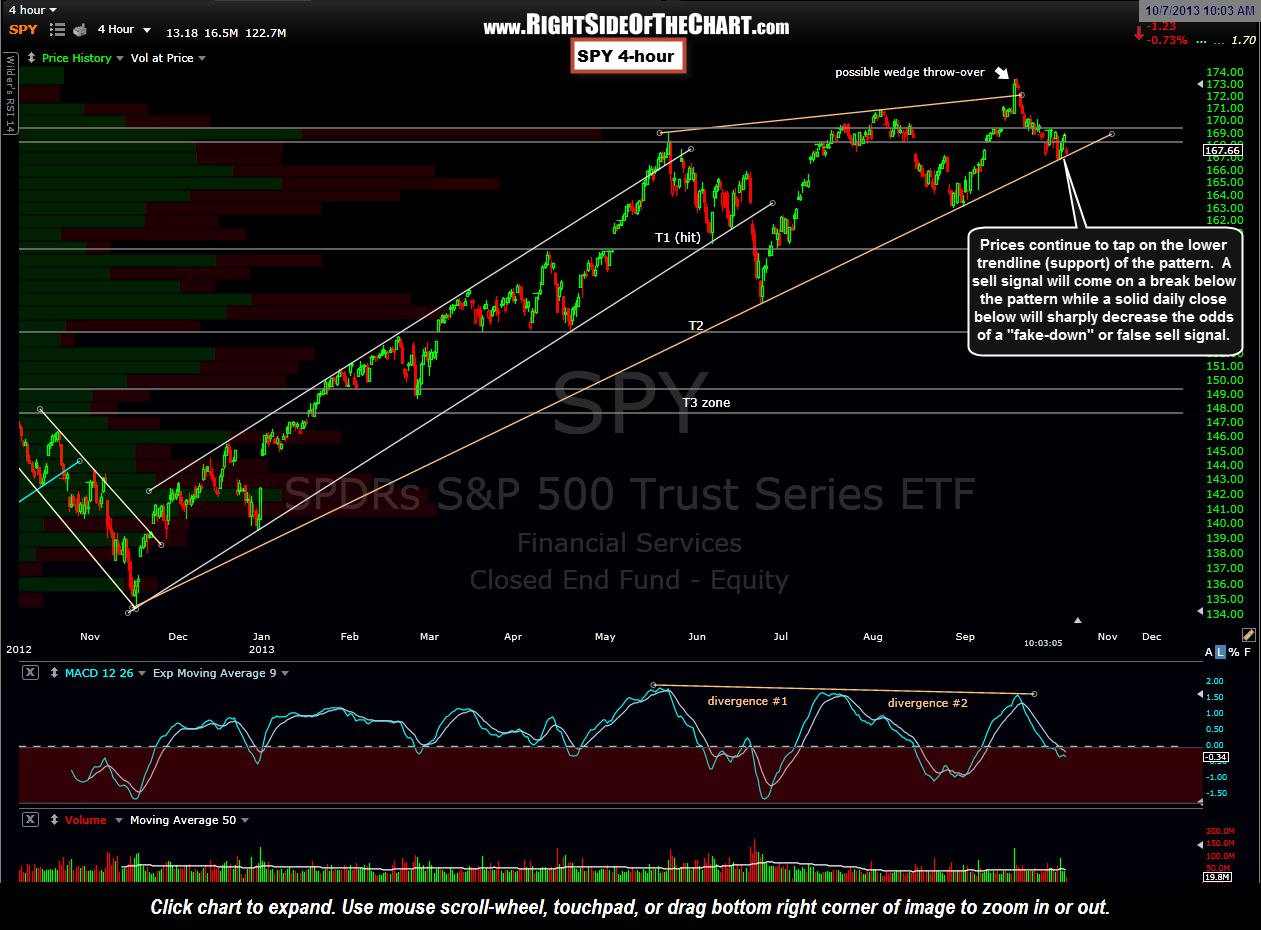
The updated 4-hour SPY chart is posted below. Prices continue to tap on the lower trendline (support) of the pattern. A sell signal will come on a break below the pattern while a solid daily close below will sharply decrease the odds of a “fake-down” or false sell signal. A live link to the $SPX daily chart from StockCharts.com, along with annotations can also be found by clicking here. Keep in mind that this link will only show end of day (previous closing) values for non-StockCharts.com members and as such, I will continue to post updates with static charts as key technical developments occur. Although not shown here, the QQQ/$NDX is also still trading within it’s bearish rising wedge pattern and as with the $SPX, prices sit just above the bottom of the wedge within the typical range of the pattern where wedge breakdowns normally occur. Although some of my short-term trend indicators are back on sell signals, the intermediate & long-term trends remain bullish for now. With that being said, my expectation remains that a break down below this patterns (once/if both the SPY & QQQ wedges break down) is likely to usher in some impulsive selling.