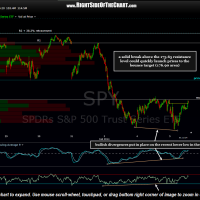
With the today’s marginal new low in the $SPX/SPY, we now have bullish divergences in place on the SPY 5 minute chart. Essentially, prices have been consolidating and basing around the T2 level (from the 2-hour chart) since hitting & making a slight overshoot of that level on Monday. It is not uncommon to see a brief overshoot of support, especially with the strong downside momentum in the markets on the way down to that key support level. Although the near-term outlook for the markets is still not as clear as it was over the last few weeks, I continue to favor the SPY moving higher towards the 176.90 area over the next few trading sessions.
A solid break above the 175.65 resistance level could quickly launch prices to the bounce target (176.90 area) as the “thin zone” on the volume at price histogram on this chart is likely to be backfilled quickly. However, should the markets reverse and move below today’s lows, that would be a bearish technical event & would likely open the door to the next wave of selling in the broad markets. My preference remains to keep things light for now & wait for either a bounce back to resistance (starting with the 176.90 area) to begin adding back some more short exposure OR waiting for a solid break below today’s lows. Of course, that is speaking generally as I try put a higher weighting in adding/subtracting to my positions based on the individual charts of each. In this case, I have some long hedging exposure to the SPY which I will remove just below 176.90, assuming that we get there, & look to add to or re-enter any attractive short trades that are offering objective entries at the time, such as a bounce back to a trendline or horizontal resistance.


