As my focus has been on the trade ideas lately, I just wanted to update my views on the broad market. Although I had the foresight/luck to ride the mid-Sept to mid-Nov correction down aggressively short and then nailed the bottom by reversing from a short to long bias, I admittedly underestimated how far this bounce might go, at least for the $SPX and some of the other lesser indices (namely the small & mid-caps). However, I did state early on in the bounce that I would not be surprised in the least to see the $NDX/QQQ bounce to the 61.8% fibonacci retracement of that prior correction (where it remains just below today after only exceeding it by a fraction of a percent recently).
Although my longer-term bias continues to remain bearish for now, as I’ve mentioned there has been quite a bit of bullish technical developments over the last month or so. I was even considering posting some charts, commentary and possible a video overview presenting both the bullish longer-term case as well as the bearish view but have decided against that for now. When I first started this site just over a year ago, one of the first things I did was to develop my mission statement. What I came up was (pasted directly from the “About” section) was: RightSideOfTheChart.com provides trading and investment ideas in addition to straight-forward, streamlined and unambiguous market analysis with an educational approach.
As that statement implies, and as I’ve mentioned quite often in the past, providing trading & investments ideas is the first & most important service that RSOTC.com provides, IMO. There is an almost endless supply of websites and publications offering market analysis out there, some good, some not so good and not unlike this site, even the good ones don’t get it right all the time. However, I continually strive to post the best looking trade ideas, both long and short, so that a trader or investor can benefit from this service even if they share a different outlook on the overall market than I do at any given time. The take-away is that my niche is finding actionable, timely & very profitable trading & investment ideas and as the track record for 2012 shows (still working on getting all the trade performance figures mapped over to a spreadsheet to post but they are all listed under the Completed Trades section) that has clearly been the case.
That brings me to the second part of the mission statement: straight-forward, streamlined and unambiguous market analysis. As this post is getting longer than most, I won’t break that statement down word by word but the gist of it is that I decided early on that I would not provide the all-to-common contradicting market analysis (…the market could go up here or it could go down) which is great for those dispensing that info since they can never be wrong (cover multiple & opposing scenarios then take credit for whichever one plays out). As I have been directly involved in the stock market my entire adult life, I know enough to know that it could go either way at any time and on just about any given day, I could make a decent bullish or bearish case on the market. However, I decided that instead of covering all possibilities, I would make every effort to present my market analysis to support the outlook that I believe is most likely, even if that assures that I will be dead wrong at times with no “outs”. At times if I am unsure or my confidence is low, I will state it vs. forcing an opinion as I have in the past.
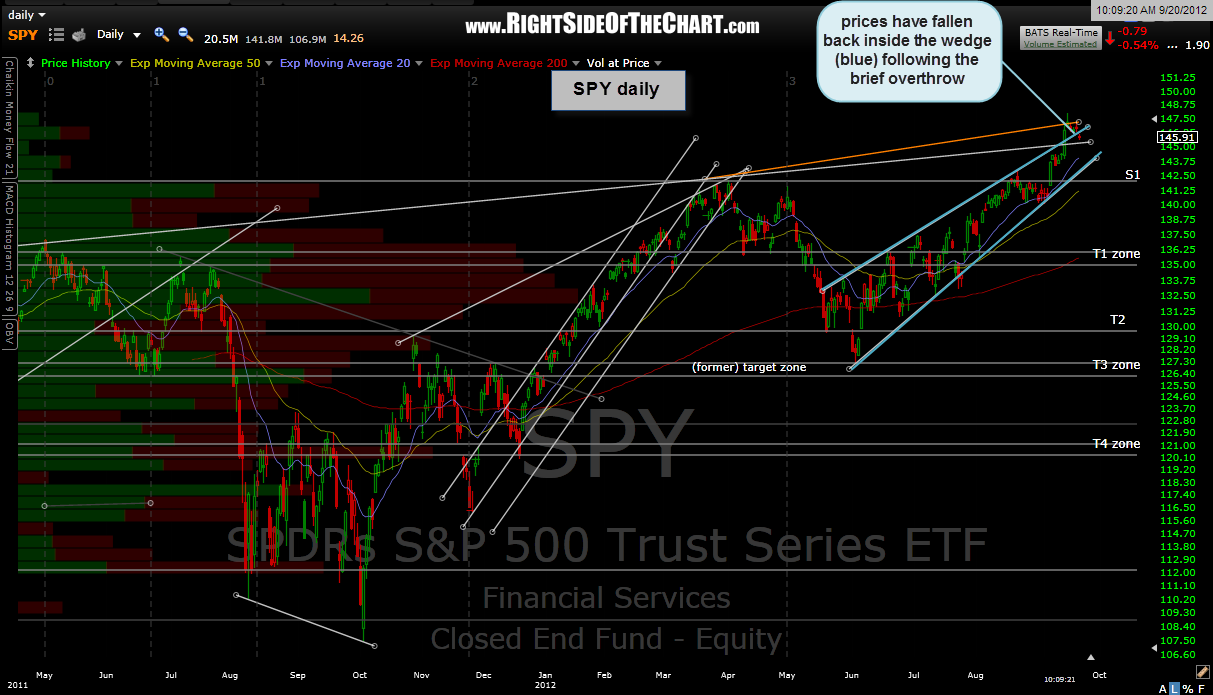
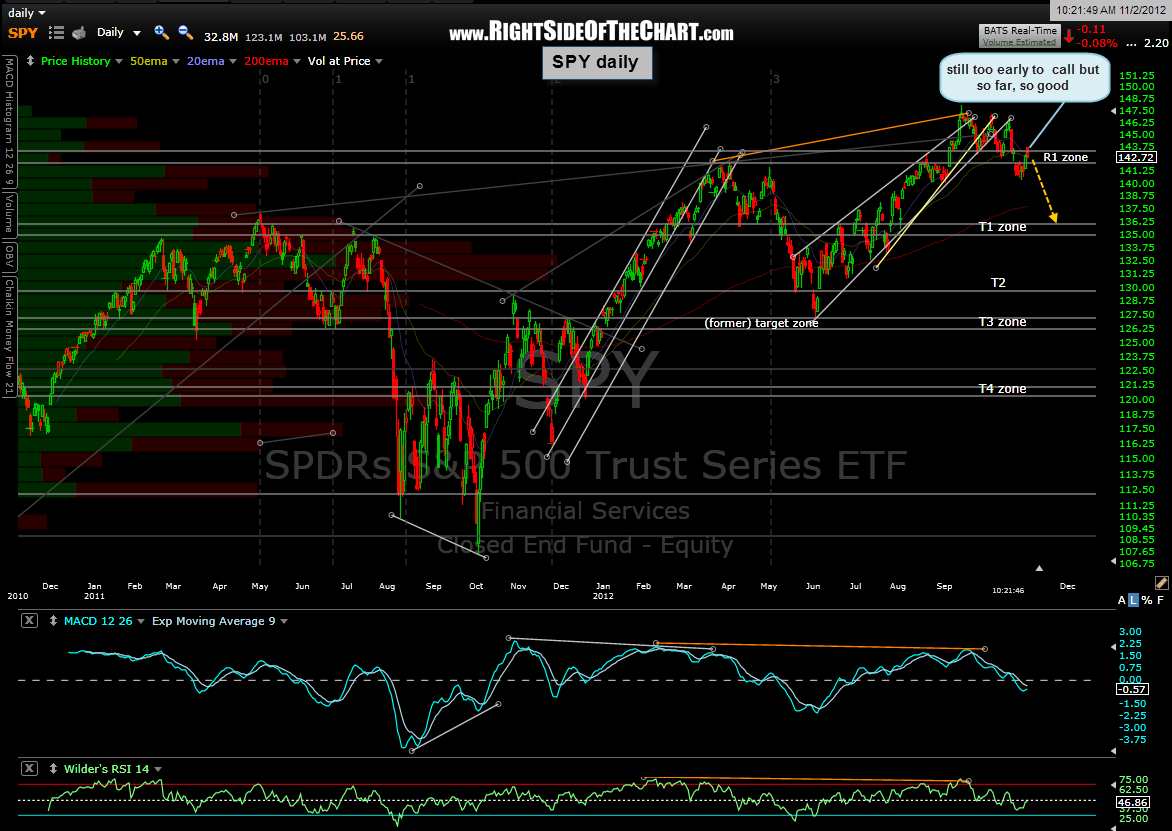
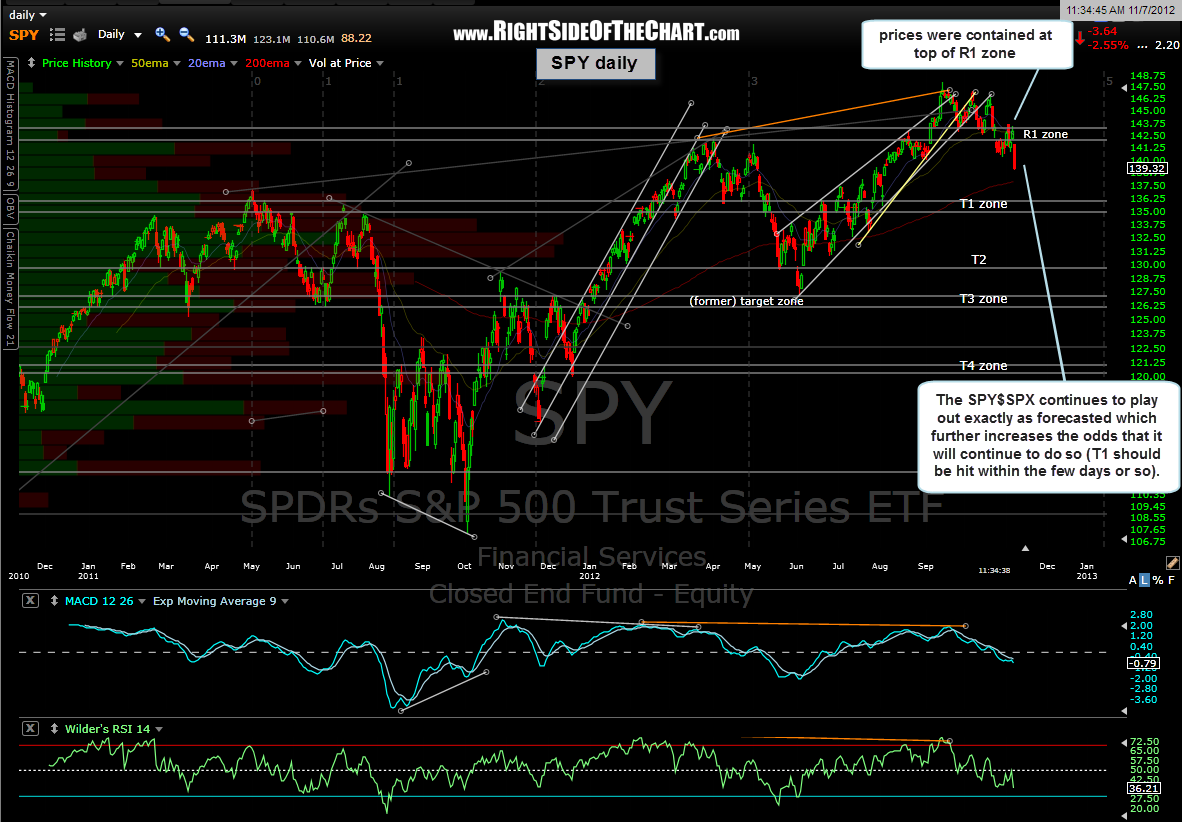
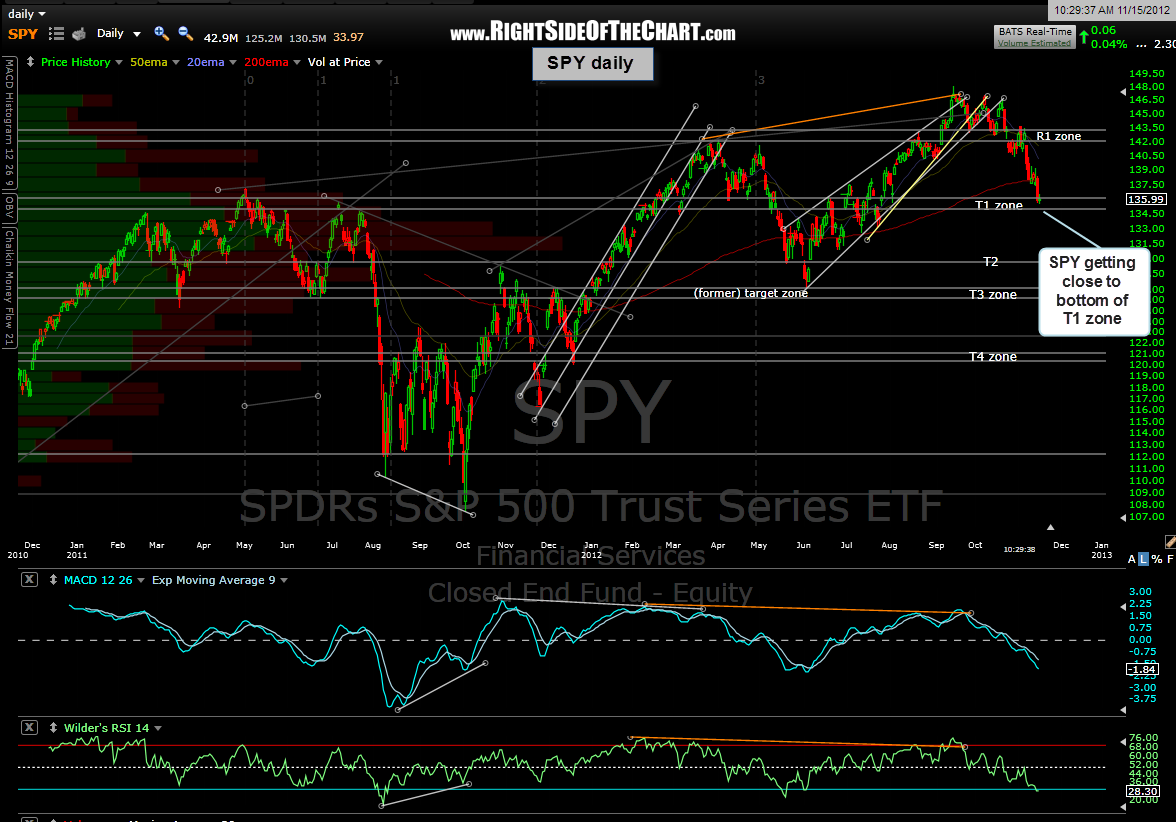
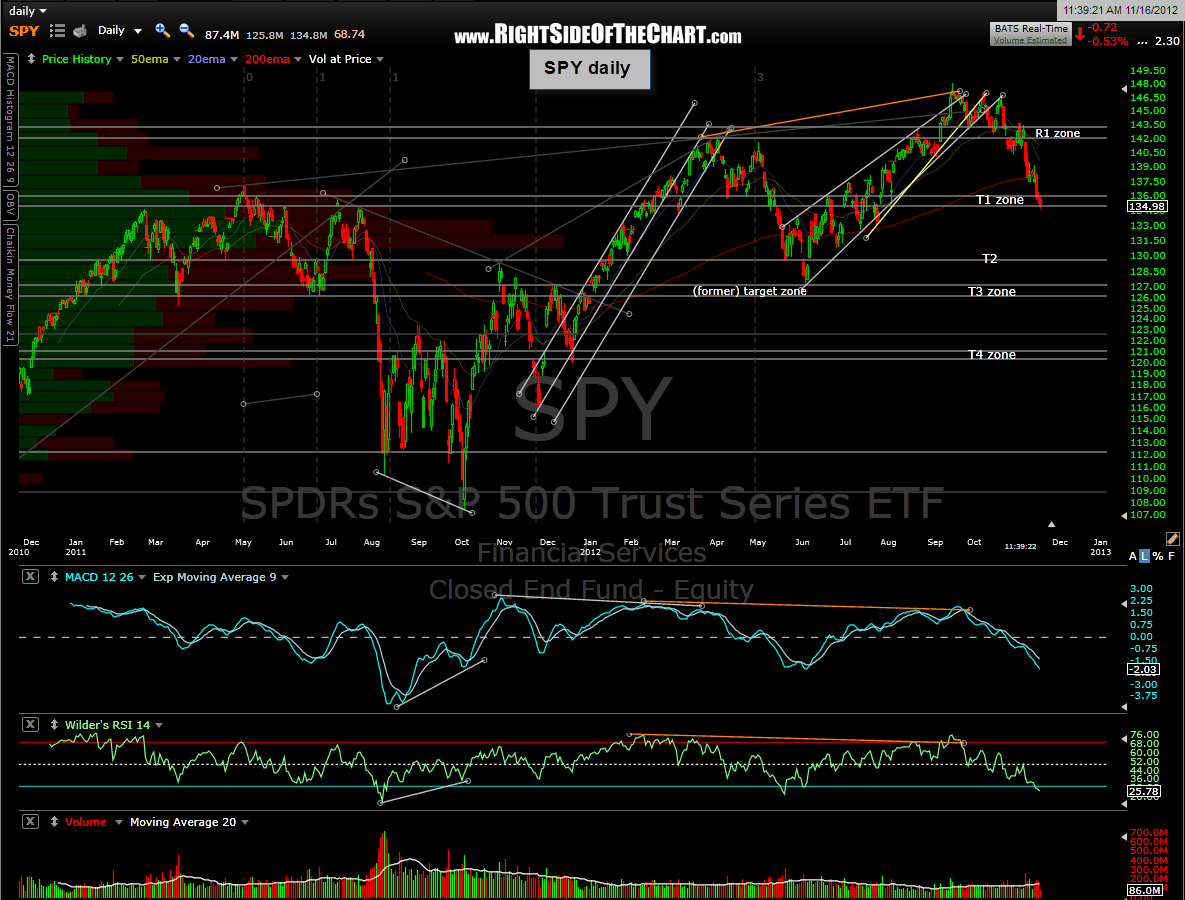
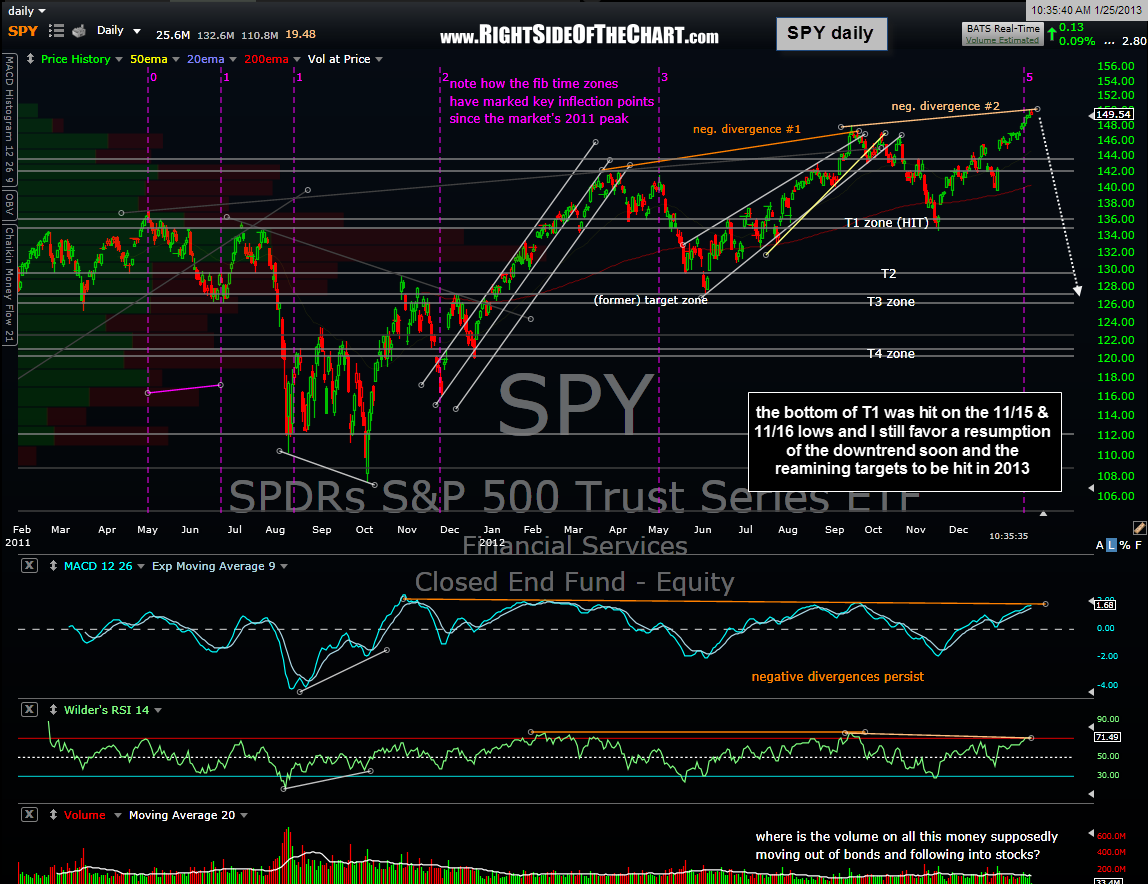
Therefore, with that being said and without further ado (rambling), here is the updated SPY daily chart along with some of the previously SPY charts posted over the last several months. This string is not all-inclusive and does not include some of the more recent SPY charts that showed the scenario(s) of that index turning down before current levels but as the markets are dynamic, so is my analysis. Therefore, I have adjusted a few of the recent trendlines however my targets remain exactly as they were posted on this first chart below, back on Sept 20th. I will also say that if these divergences don’t play out relatively soon via a reversal in stock prices and a break below the former T1 level/ Nov 16th lows, then this longer-term bearish scenario will begin to rapidly dissipate as prices move higher from current levels. Here’s the (partial) chain of SPY daily charts, dating back to Sept 20th with additional charts on some of the other key indices and sectors to follow soon. The last chart is today’s updated chart with the salient technical points annotated.