
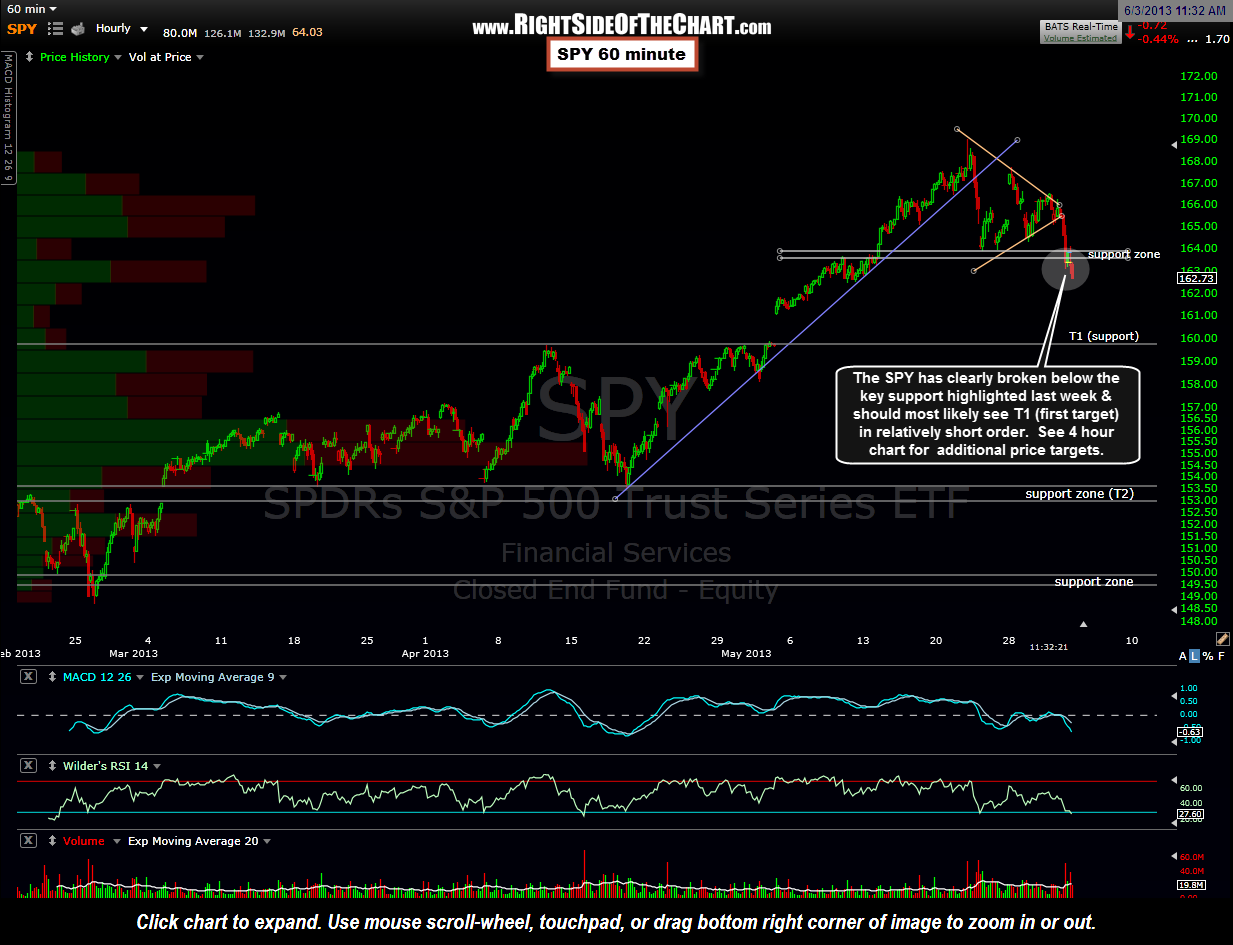
 This first chart above is the updated 60 minute chart showing that prices have clearly broken below the key support level and will likely move rather impulsively down to the 159.85ish level. Zooming out to the 4-hour period chart below, we can see that level is not only decent horizontal support but also the bottom of a longer-term ascending channel in the SPY/$SPX which makes that a very critical support level.
 Normally, I might book some short profits or take a shot at some longs there but based on the scope and duration of that channel, coupled with the recent channel overshoot (along with many other factors as well), I would put the odds at very good that any reaction at the bottom of that channel will be relatively short-lived. If prices do break below the channel as expected, the next two targets are shown below.