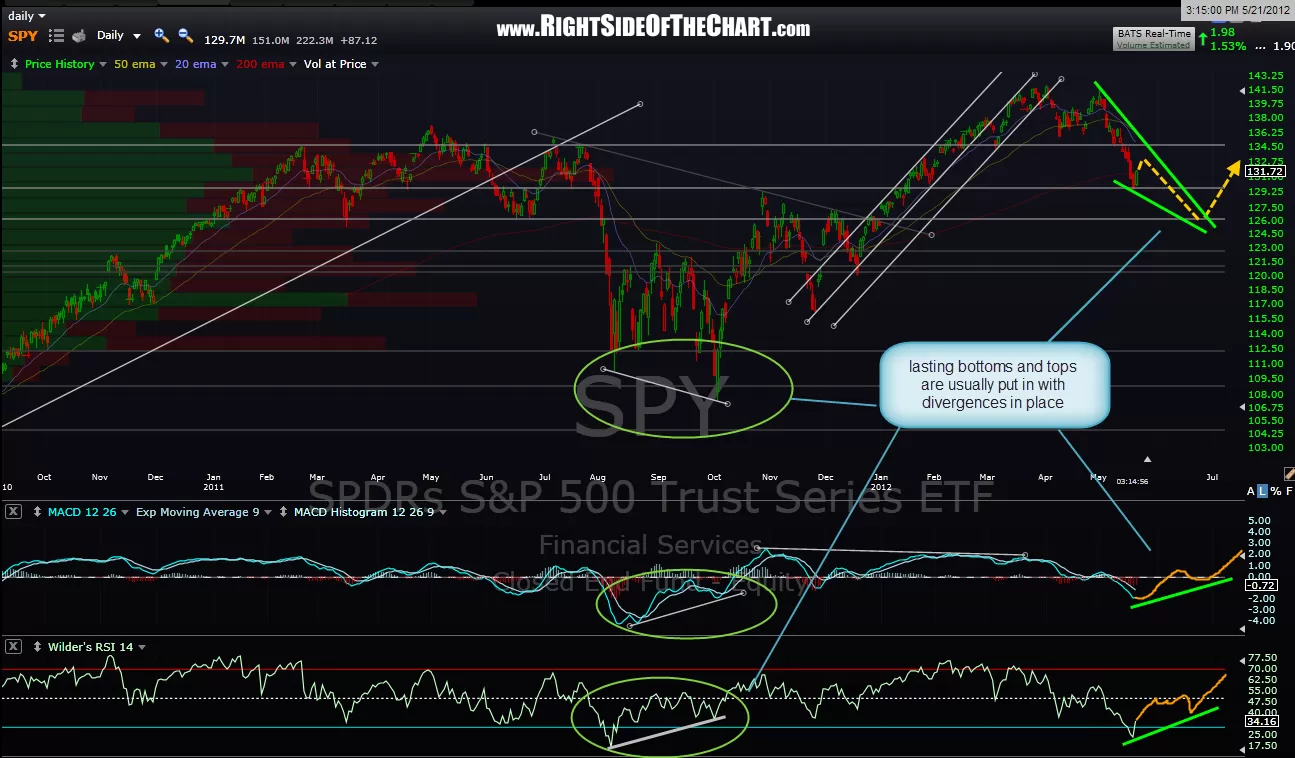
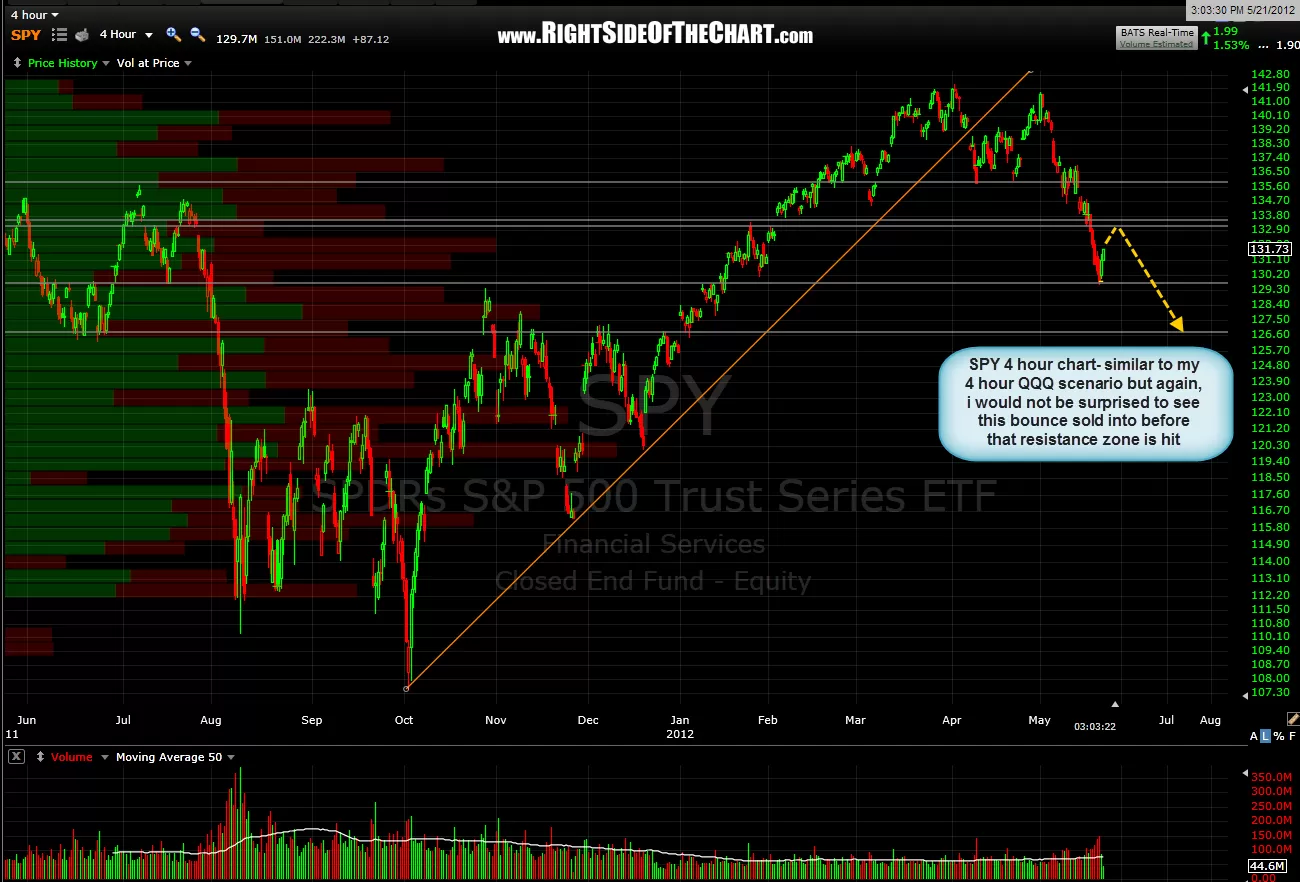
my primary scenario for the SPY on this 4 hour chart is similar to the QQQ 4 hour below. i wouldn’t be surprised to see the markets turn down before those resistance levels, assuming the intermediate term downtrend is still intact and the markets are going lower (my preferred bigger picture scenario) as counter-trend bounces during strong trends often fall short of the expectation of the masses in order to trap the maximum amount to traders. right now, you have a lot of late-comer shorts getting squeezed and the buy-the-dip bulls rejoicing that they finally nailed a bottom as they bought in with their last few nickels of margin buying power. i’ve also included what would be a nice looking scenario in which to get aggressive on the long side, if things were to play out this way (market turns back down soon, putting in a new low but with positive divergences across the board on many of the oscillators and indicators). fwiw, i will be selling the SSO long hedge that i took before the close on friday here shortly. the SPY is now just below the 2nd blue line (potential bounce target at 132.10) from the 120 minute chart posted earlier today. this may very well prove to be a premature exit but i still have enough dry powder to continue scaling short if the market pushes higher in the next day or two.