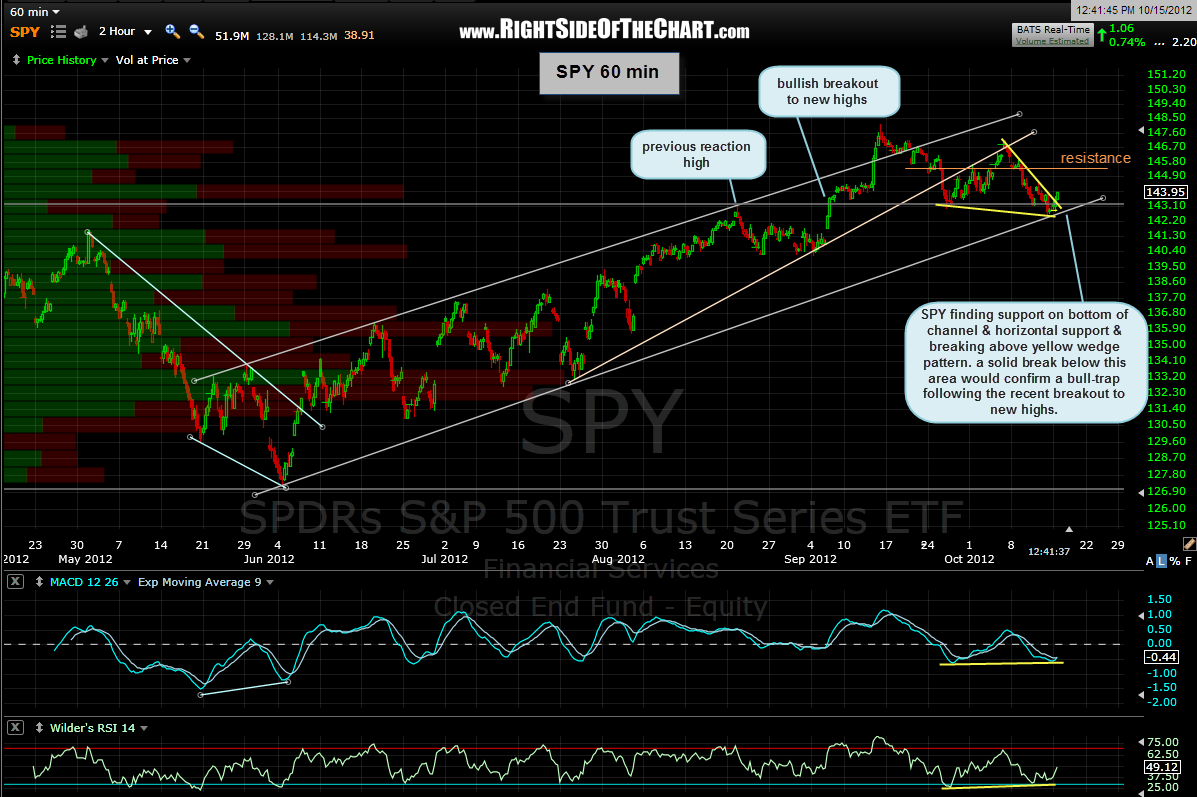
here’s a 60 minute chart of the SPY, showing that prices have bounced of the bottom of the ascending channel after slightly dipping below the key “bull-trap” support level. i do favor a break below this level soon but it’s just hard to say how much further we bounce before prices continue to move lower. note how there were positive divergences in place below the falling wedge pattern (yellow) within the larger channel. after bouncing off the bottom of the channel today, prices bounced and broke above that pattern. in an uptrend, i would favor the higher end targets for that pattern, maybe that orange resistance line on this 60 min chart. however, bullish pattern breakouts during larger downtrends (if indeed, we are in the early stages of one, as i believe) tend to fall short of technical projections as they get sold into early by trapped longs waiting for any half-decent bounce to get out.
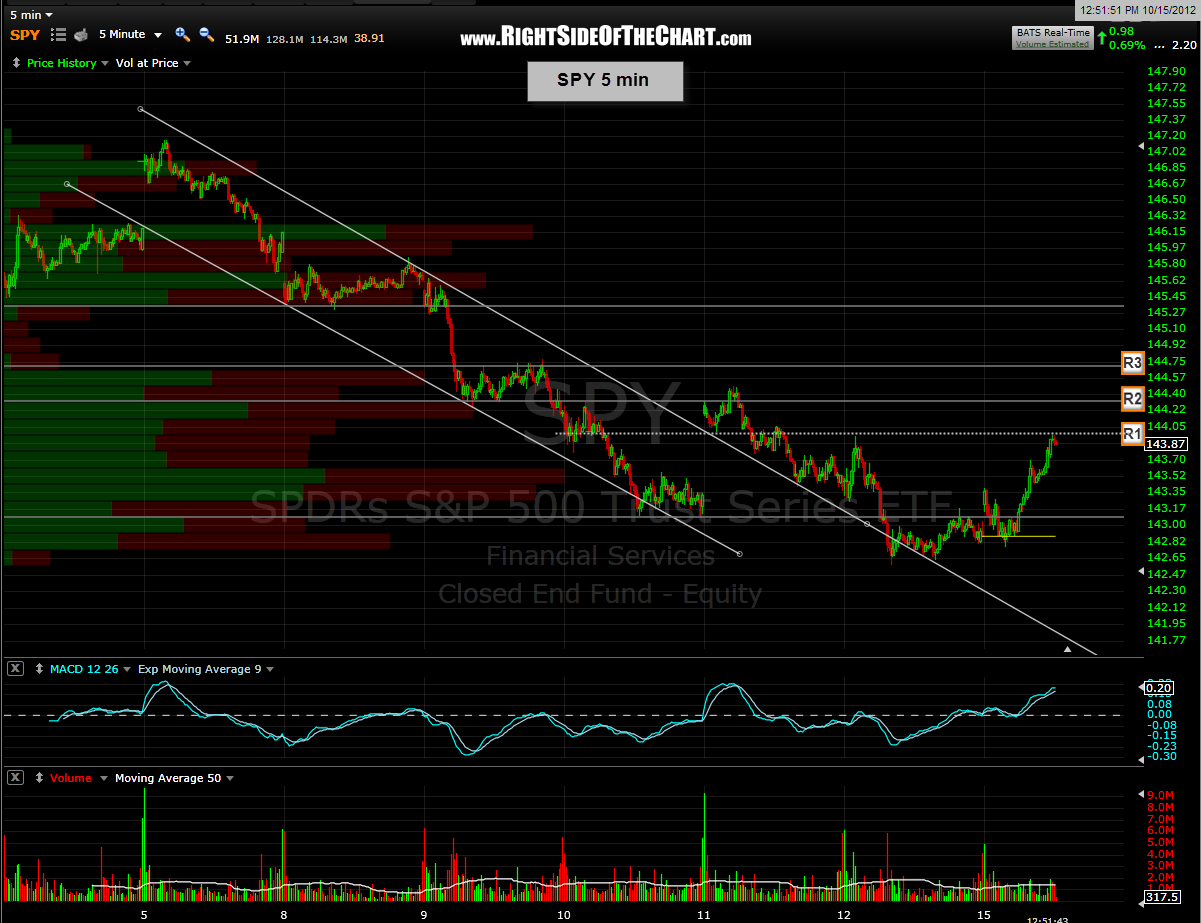
zooming into a 5 minute time frame, i have noted a few levels that might act as resistance over the next few trading sessions. keep in mind that not only are we now in the thick of earnings season but we also have a very active economic calendar this week plus options expiration on friday. therefore, i would expect a somewhat volatile trading week marked by opening gaps and significant intraday swings so make sure to adjust or hedge your positions according to your risk tolerance.


