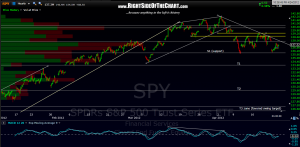
 updated SPY 60 minute chart with some resistance levels to watch for. the near-term trend remains down for now so the SPY could turn down off any of these levels, should tonight’s AAPL induced after-hours pop carry-over to into tomorrow. of course, if the upper-most resistance zone on the chart (parallel lines around 140.28-140.65ish) gets taken out, that would be bullish and likely keep the intermediate and long-term uptrends intact. if prices turn down before making new highs and impulsively move lower, breaking the recent lows (S1 support), that will most lost likely open to door for my downside targets to be hit very shortly thereafter and shift the intermediate-term to down as well.

