
SPY 5 minute Feb 6th
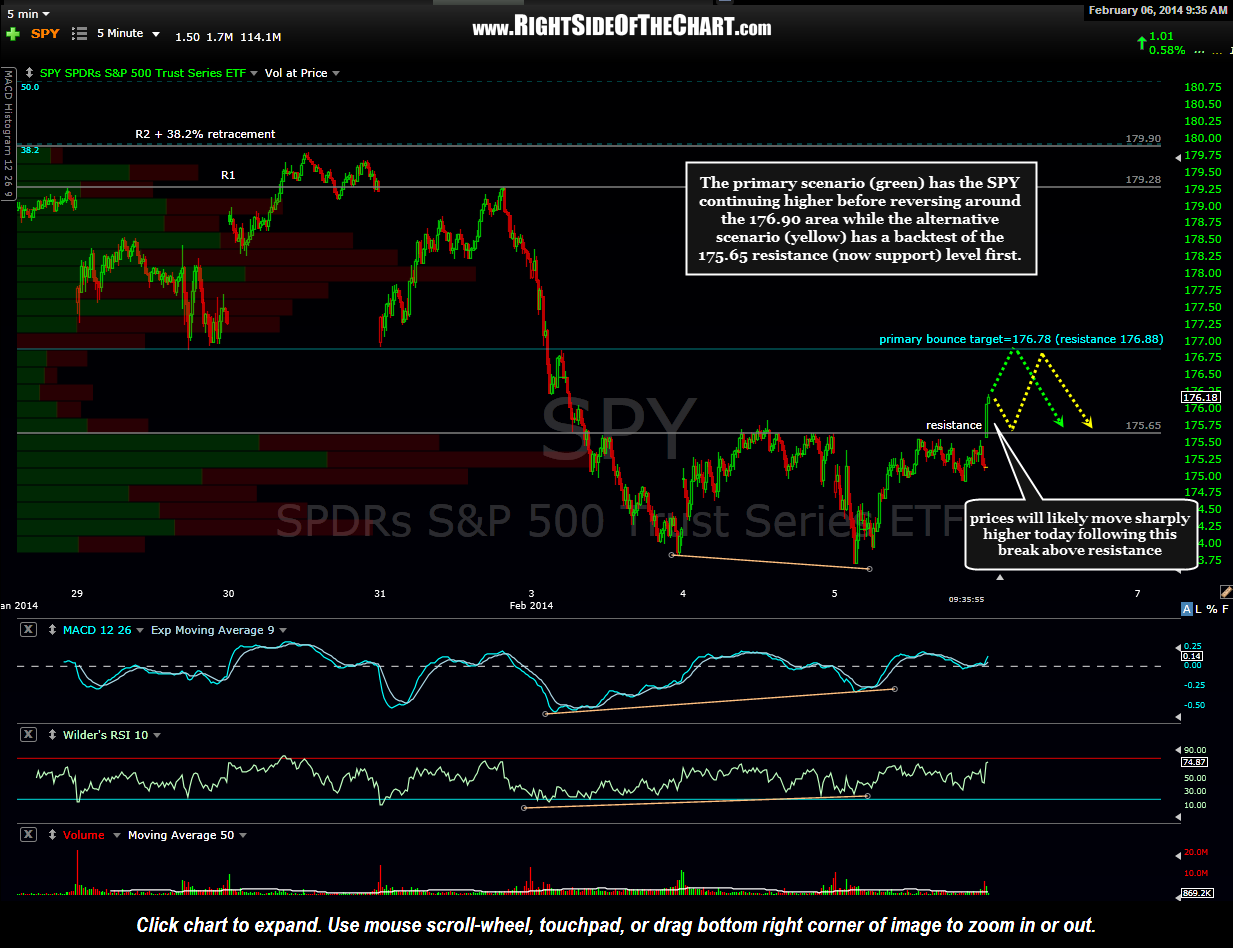
The aforementioned 175.65 resistance level on the SPY was taken out shortly after the open today. As per the previous scenario laid out on the 5 minute chart, this break above the recent basing pattern of the SPY/$SPX opens the door for a move up to the 176.90 area. As outlined in this updated 5 minute chart of the SPY, my primary scenario is a relatively quick move, most likely today, up towards the 176.90 area followed by a reversal from that level. To be more precise, I have the resistance coming in at 176.88 however, I plan to close my SPY long bounce trade/short hedge position around 176.78 as there are undoubtedly too many eyes targeting the 176.90 area to either go short and/or close long positions. When too many traders are all watching the same level, prices will often reverse shy of that level. My alternative scenario would be to see a backtest of the 175.65ish broken resistance (now support) level before a move to the bounce target. If anything else develops, such as a sharp reversal & move back well below 175.65 or a move well above 177, I will try to update my scenarios asap. G00d trading. -RP