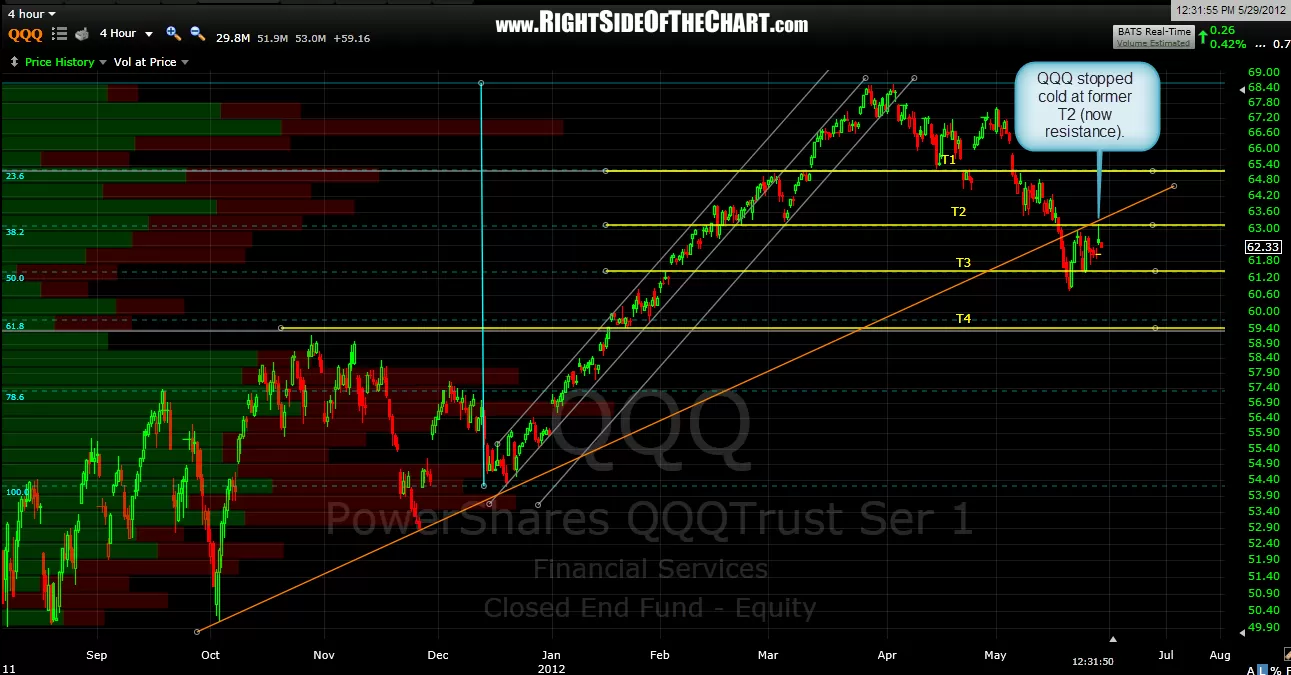
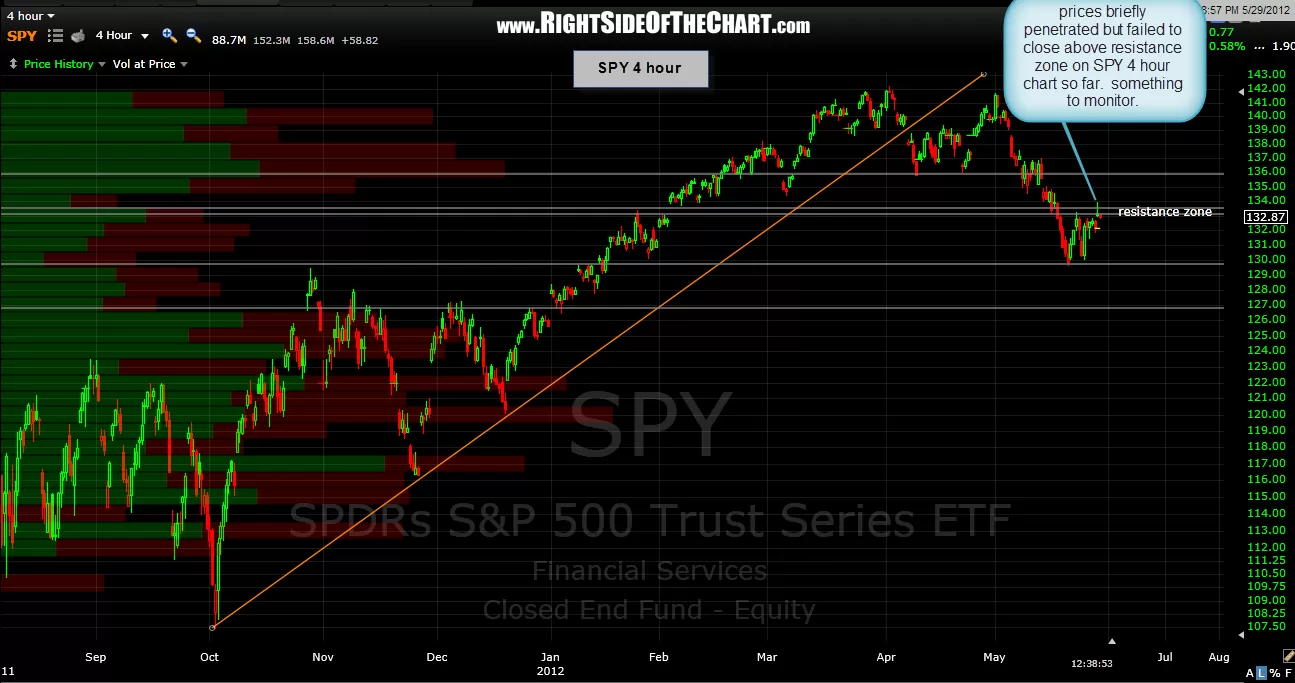
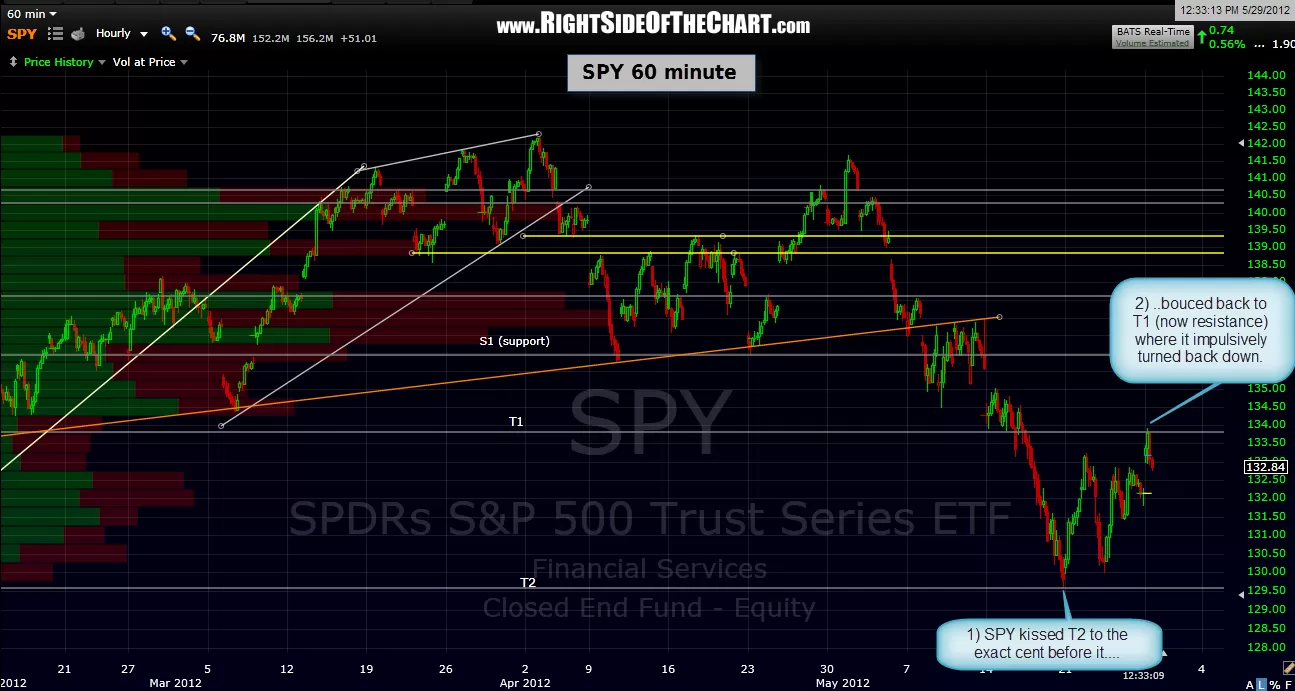
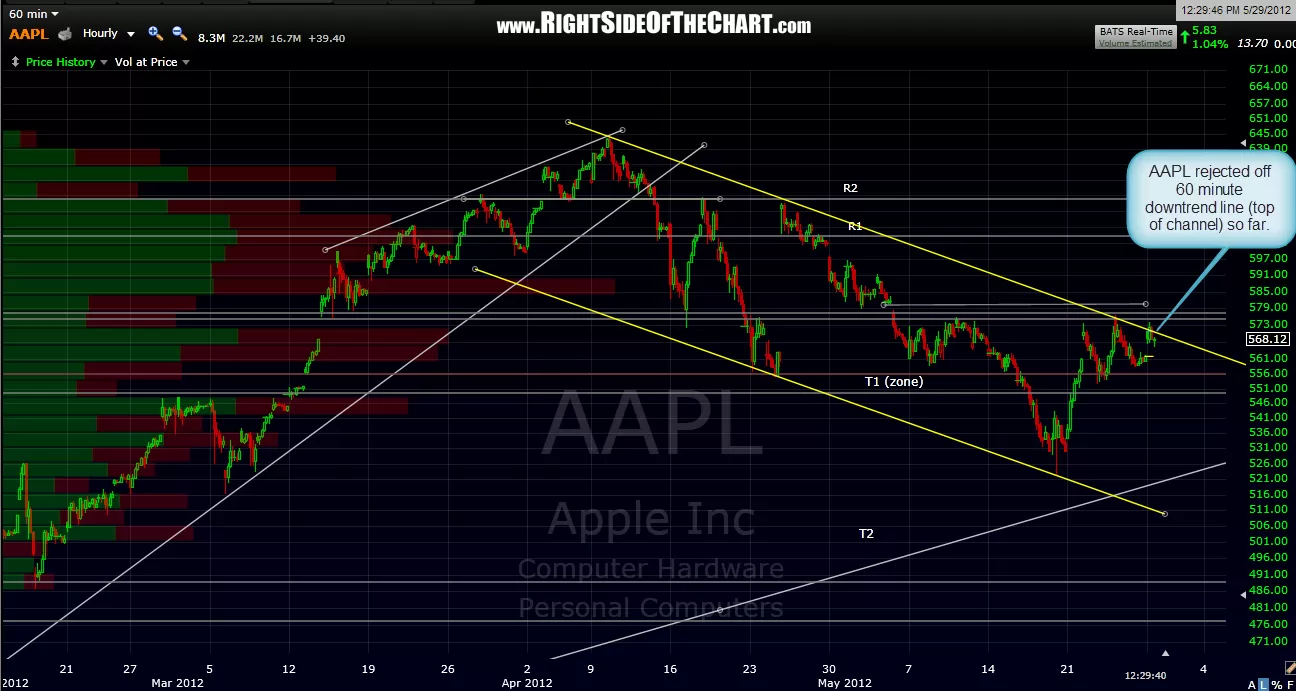
so far, prices turned down impulsively at the aforementioned resistance levels on the SPY, QQQ, and AAPL. although that in no way means that they can’t or won’t regroup to make another run at and possibly break above those levels, it does help validate that those levels are indeed significant resistance levels being watched by traders. therefore, a break above those levels who be bullish and likely spur the next wave of buying up to the higher resistance levels while a failure for prices to break above that level sometime soon would likely result in the markets turning back down and resuming the intermediate term downtrend and likely breaking or at least re-testing the may 18th lows. personally, i’m still sitting on my hands for the time being, waiting to see if these levels are taken out or if prices turn lower and break below those pennant and flag patterns which are still intact at this point. charts below are the AAPL 60 minute, SPY 60 min, SPY 4 hour and QQQ 4 hour.

Results for {phrase} ({results_count} of {results_count_total})
Displaying {results_count} results of {results_count_total}