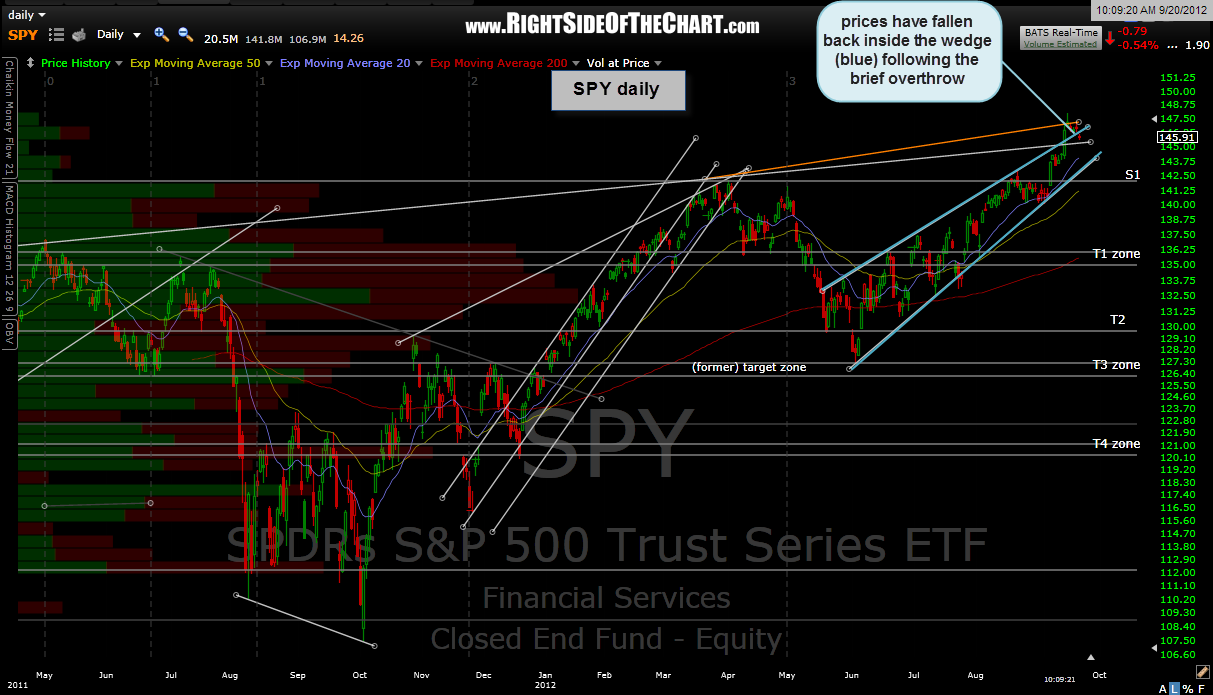
updated SPY daily chart. targets remain as previously shown although i did modify the first target into a target zone and also add a key support level (S1) which i would be very bearish once (if) prices break below. when (if) that happens, i would expect the selling to accelerate and quickly bring prices to the first target.
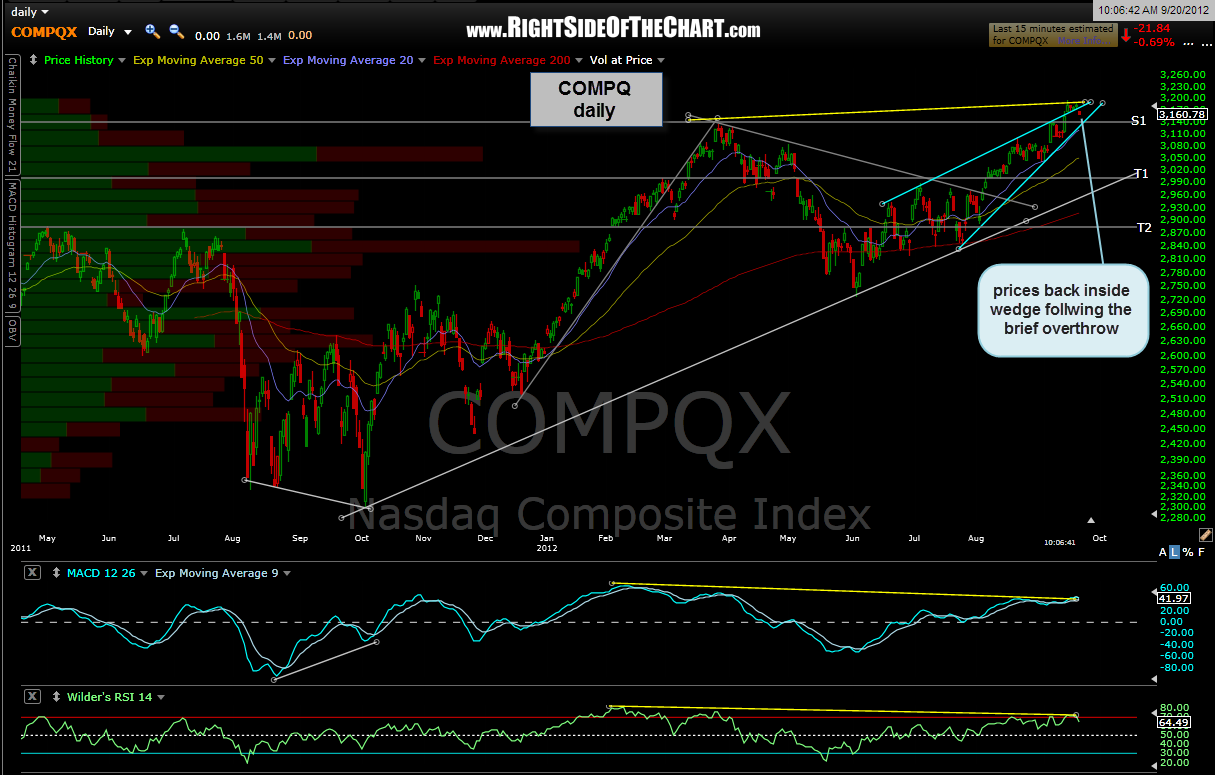
as of this morning, we now have the expected move back inside of the rising wedge patterns on the key indices’ rising wedge patterns. step 1: check. as discussed in the recent market update video, the next step would be a downside break of those rising wedge patterns. then a break of the S1 levels on both of these charts (SPY and COMPQ daily charts below). therefore, there’s still a lot of work to be done from a technical perspective to help solidify the bearish case and increase the likelihood that these downside targets will be hit although i remain confident this is the most likely scenario. nearly every dip has been bought up aggressively for months now so a red close today would at least signal a change of character in the market and keep prices back within the rising wedge patterns.