
SPY low volume sell signals
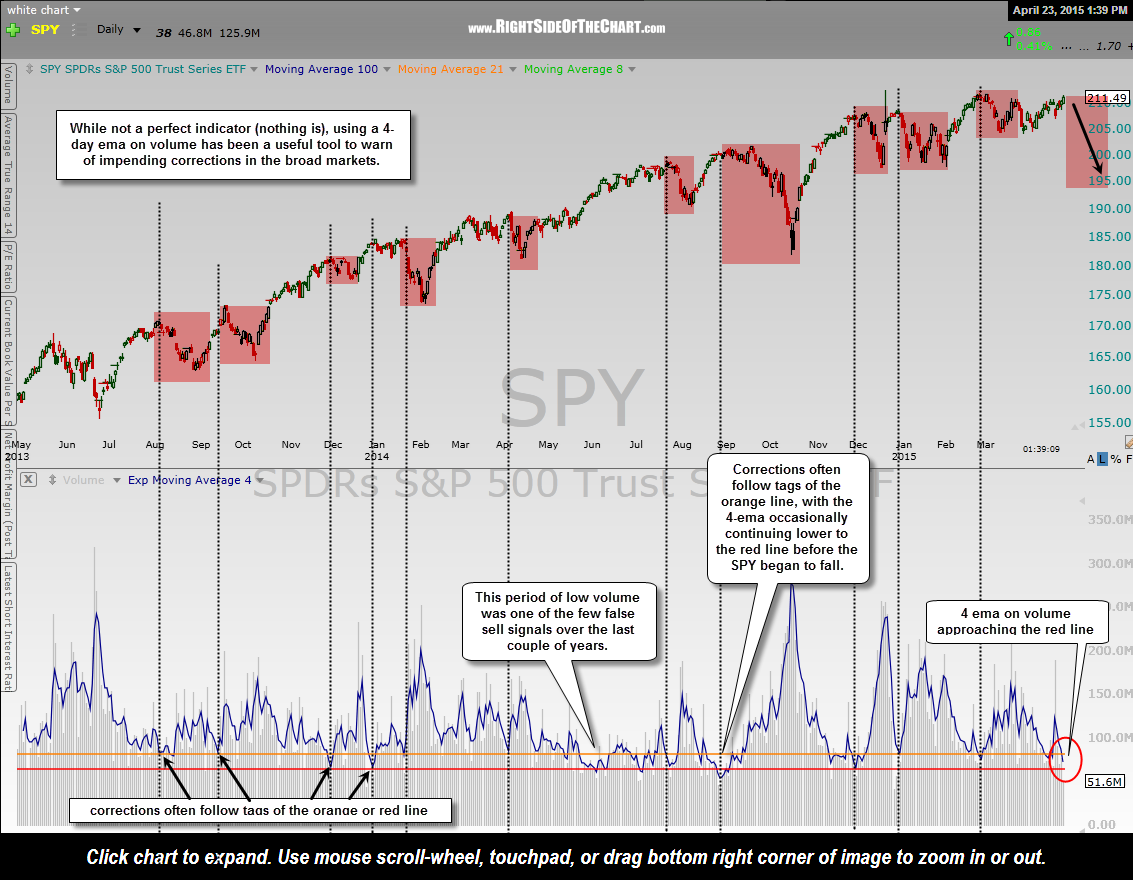
On this 2-year daily chart of the SPY (S&P 500 Index tracking etf), I’ve plotted a 4-day exponential moving average onto the volume. Although not a perfect indicator (as there is no such thing), volume trends can often give us a heads up on trend changes (e.g.- buying & selling climaxes) as well as minor & not-so-minor corrections, as shown here.
I have added two horizontal lines to the volume on the SPY, orange & red. Typically when the 4-day ema drops to the orange line, a correction ensues either immediately or very soon thereafter. Occasionally, volume will continue to fall while price rise until the 4-ema reaches the red line. Remember, rising prices on declining volume is typically a bearish sign as stock prices are being driven higher by fewer & fewer buyers until the point is reached in which the buyers simply dry up & a correction ensues.
Although each & every tag of these “sell signal” lines (i.e- the false signals) isn’t marked in order to keep the chart somewhat clean, you will notice that every single significant pullback in the SPY over the last couple of year was immediately preceded by the 4-day volume ema falling to one of these sell signal levels. In fact, the SPY just tagged the orange line last week without a substantial correction and has now moved below. Should trading volumes continue to fall this week, we are likely to see the 4-ema reach the red line very soon. The previous two tags of that level were followed by 5% & 9% drops in the SPY.
note: The results of these volume plunges are almost identical on the QQQ and other broad market trading ETFs.