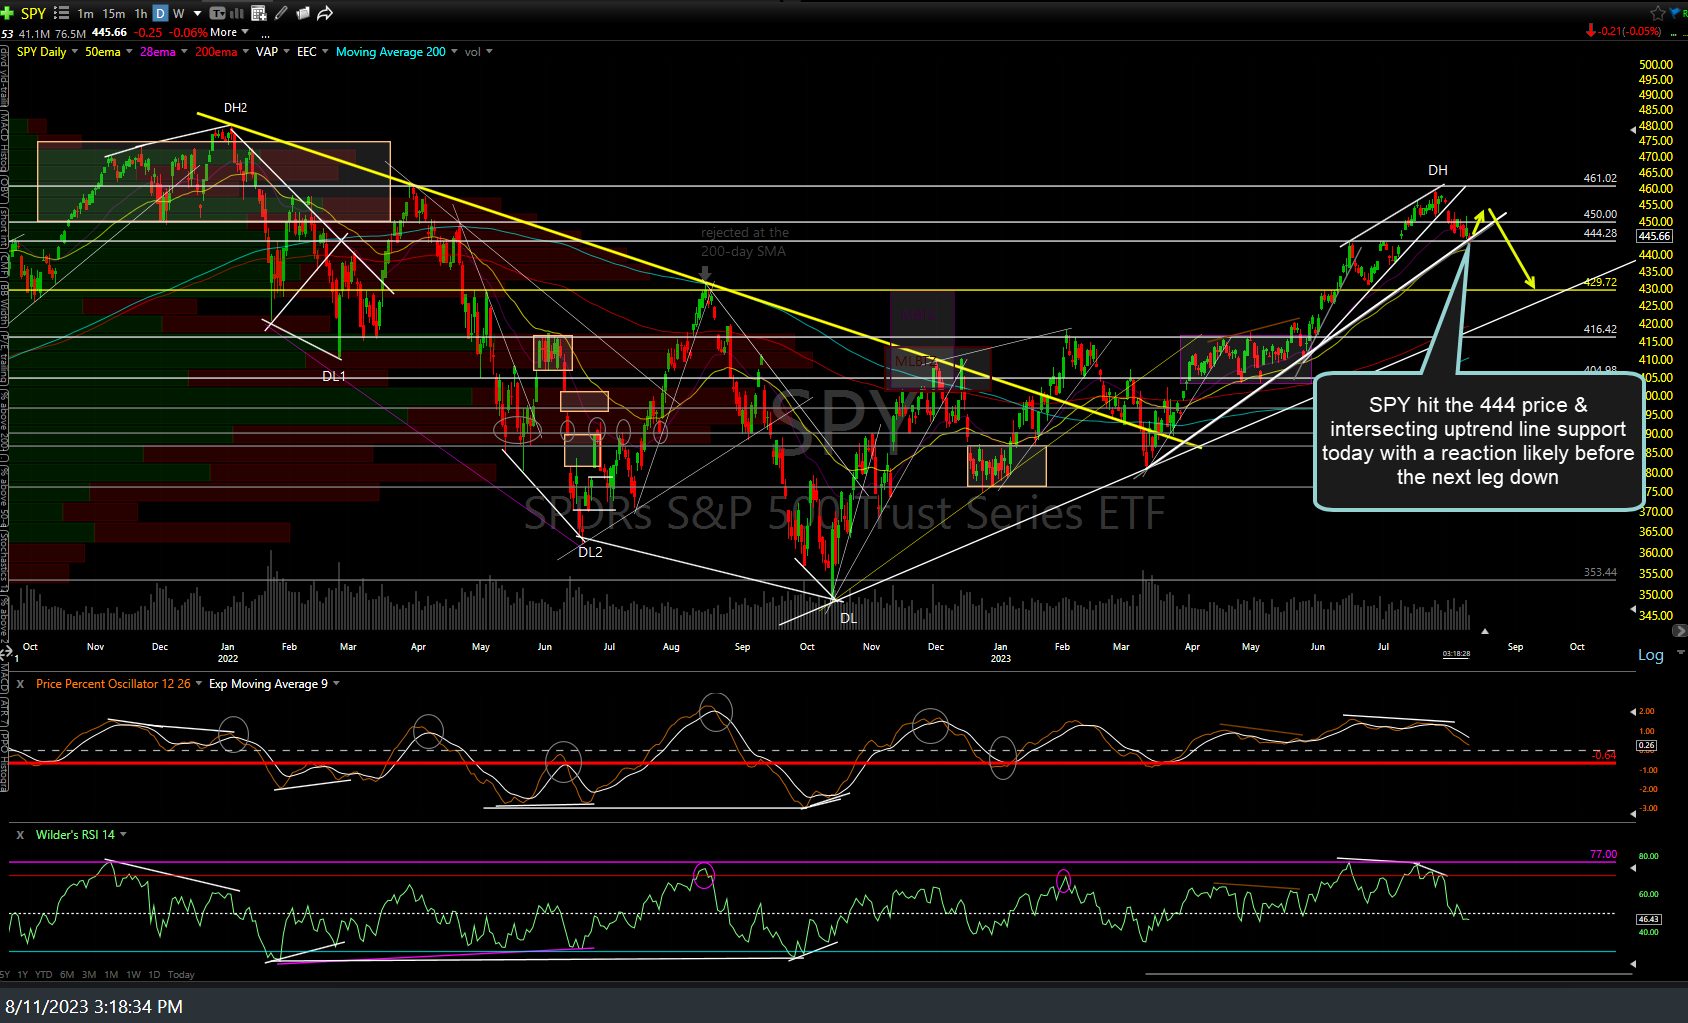
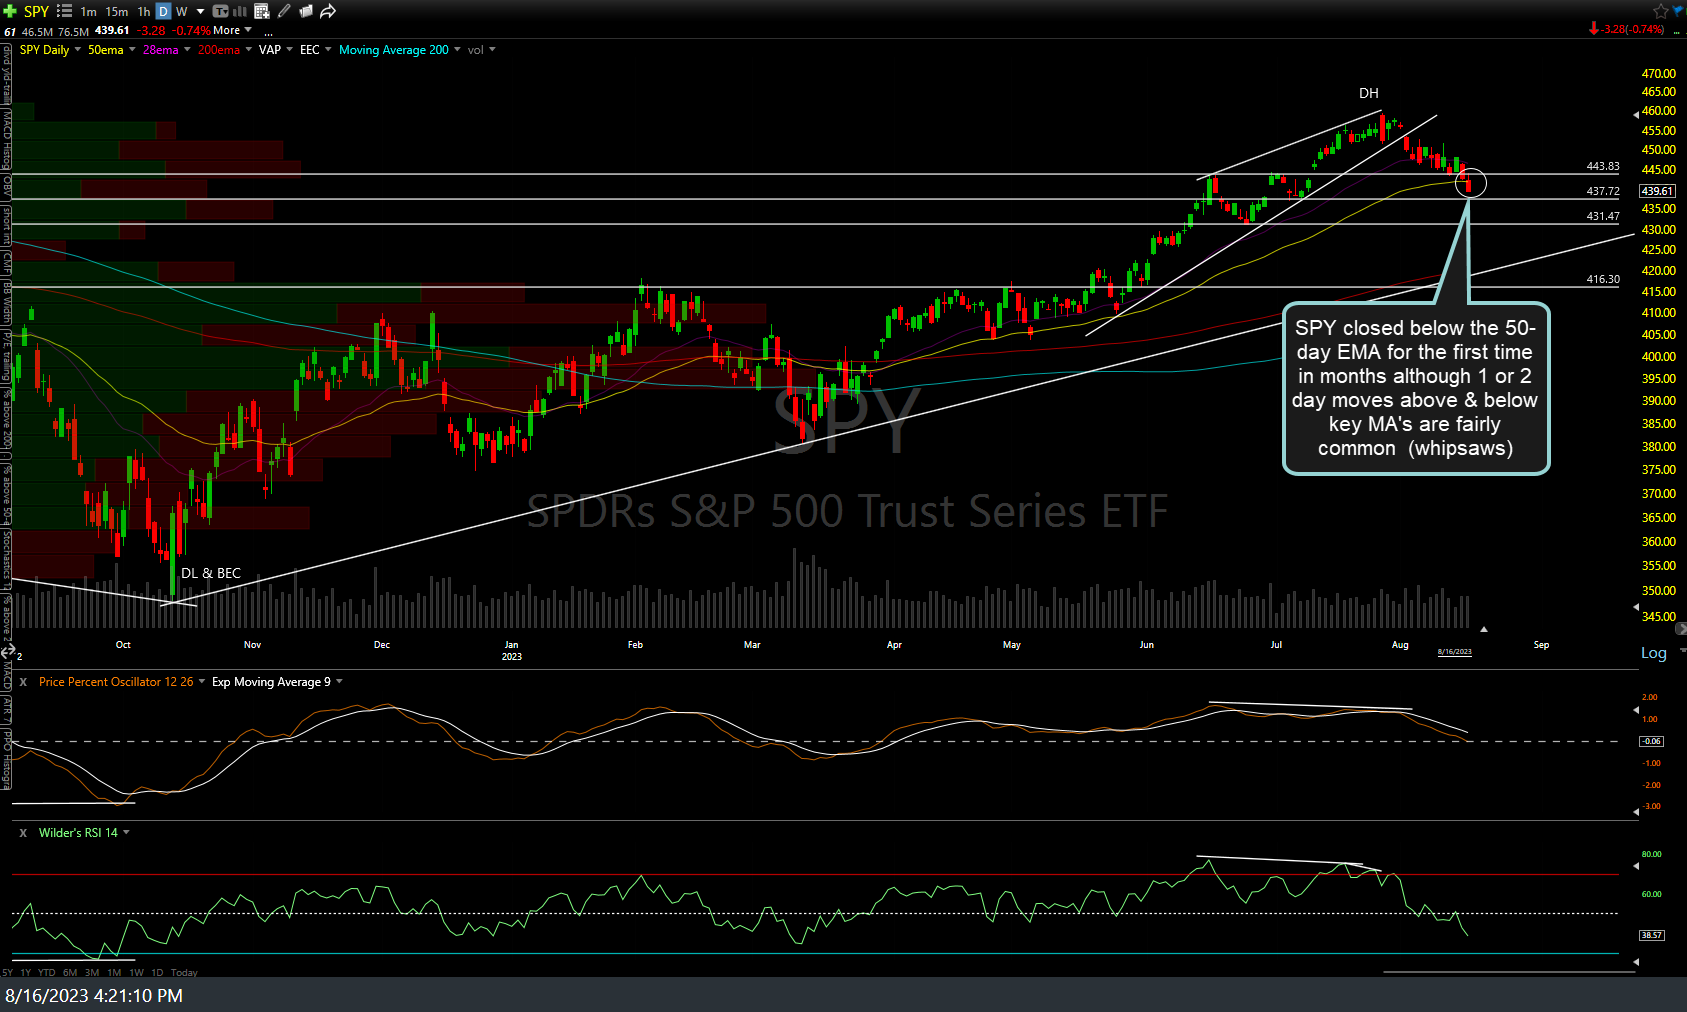
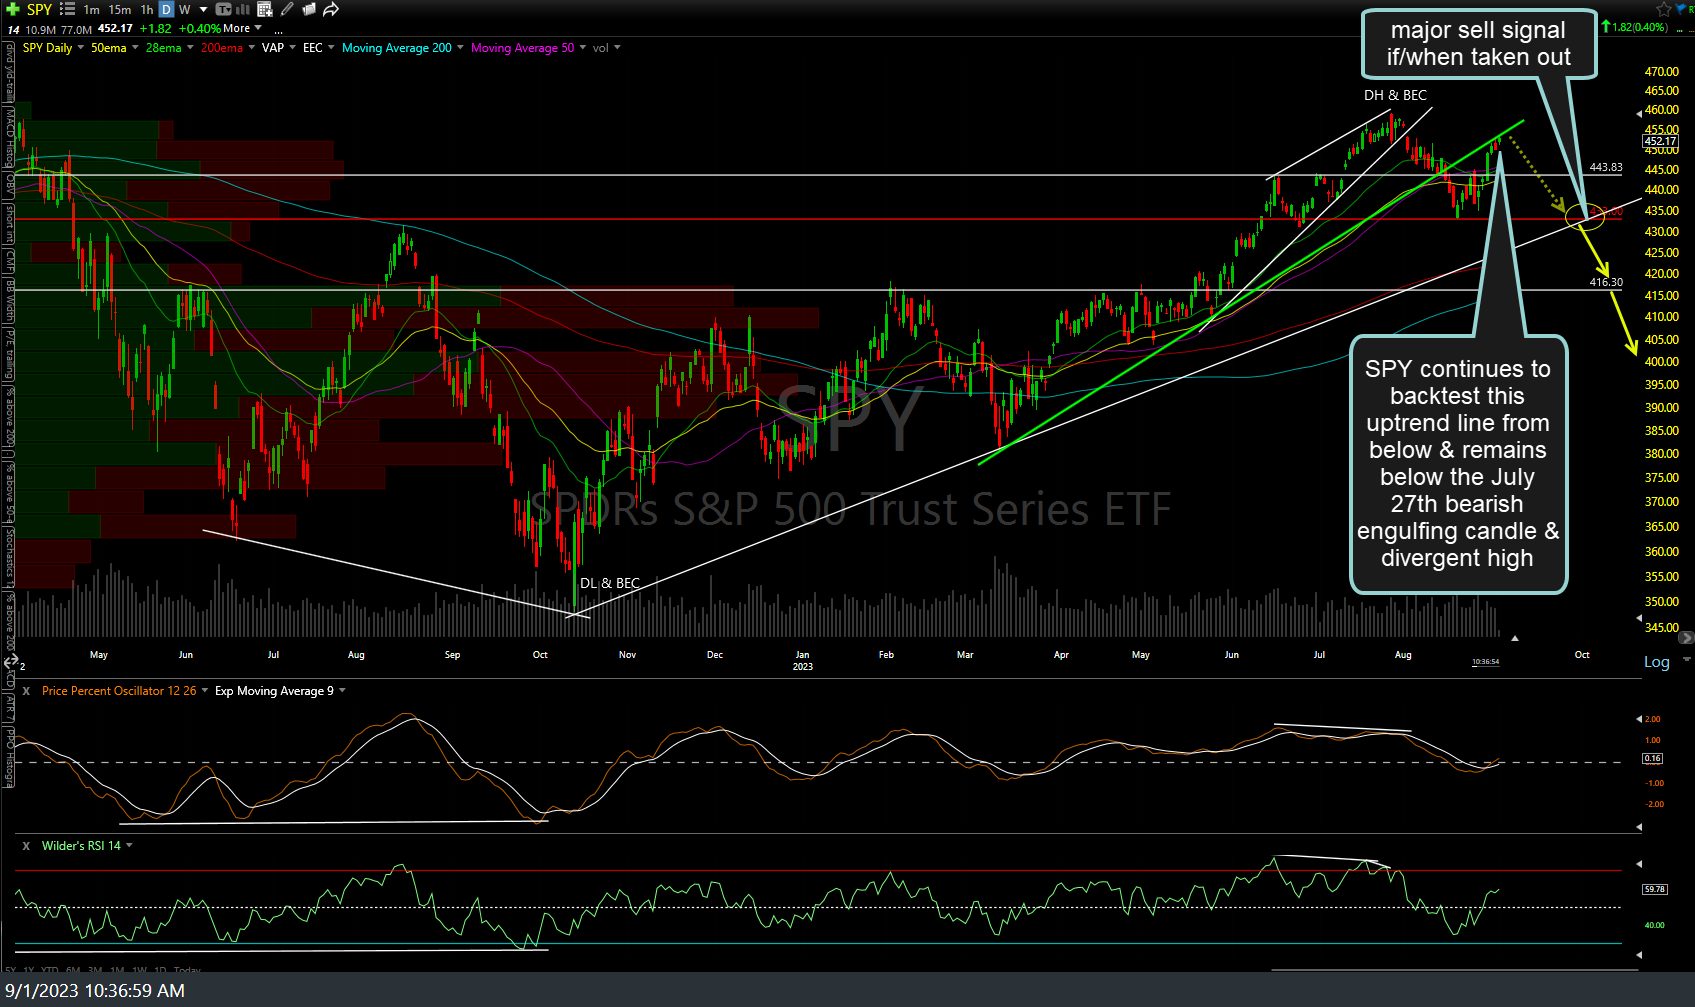
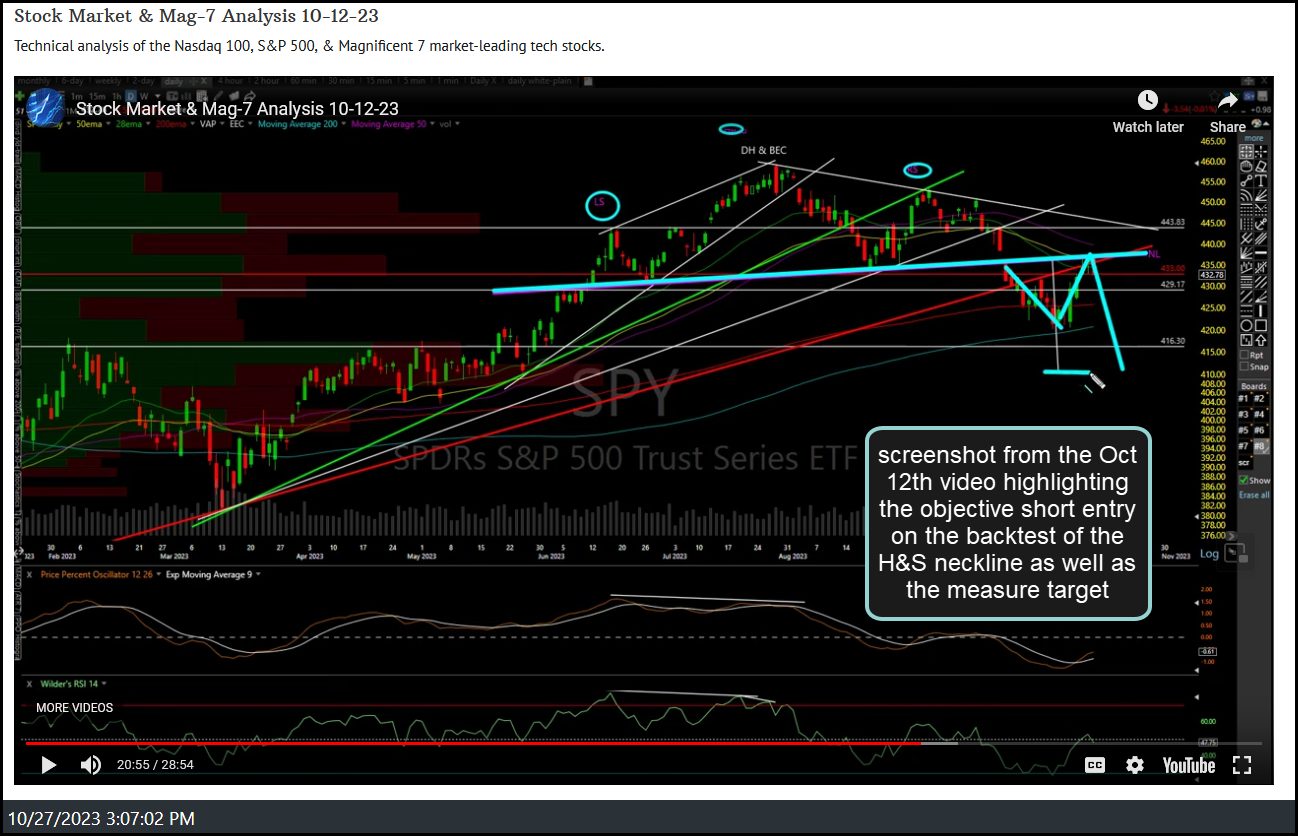
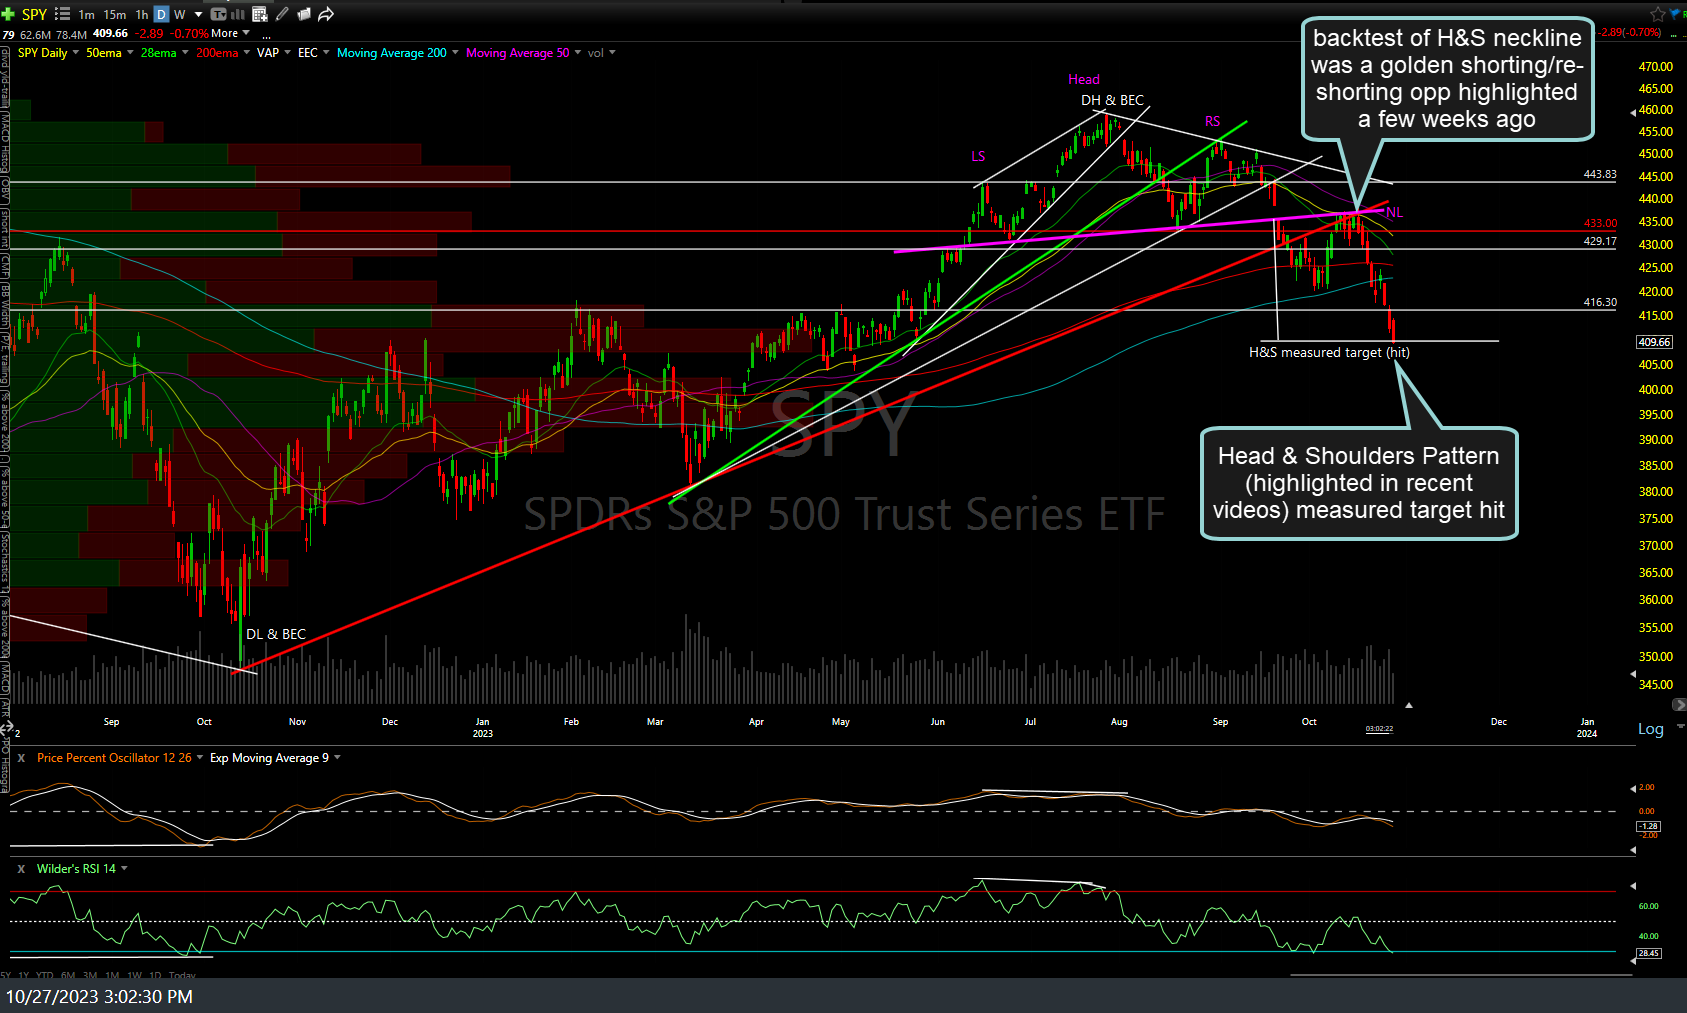
SPY (S&P 500 ETF) has just hit the measured target of the Head & Shoulders topping pattern that I’ve been highlighting in recent videos, including the very timely & profitable short entry on the backtest of the neckline during this video posted back on Oct 12th. The previous & updated daily charts (including a screenshot from that Oct 12th video highlighting the backtest & measured target) are below (all 3 previously posted daily charts Aug 11th, Aug 16th, & Sept 1st, highlighting all the next sell signals & likely path of the S&P 500 along with the Oct 12th video screenshot).
Bottom line: In addition to the multiple objective short entries & price targets on those previous charts, the fact that SPY has now hit the measure target of the H&S pattern increases the odds for a reaction here (and next week) so the R/R for adding new shorts or remaining heavily short just isn’t very good right now, at least until the next key support levels on the indexes & market-leading stocks are clearly taken out. Typical swing & trend traders might opt to tighten up stops on shorts (or longs) or reduce some exposure as well head into the weekend as next will could just as likely see a big drop or a big pop in the market (i.e.- roughly bilateral risk… not worth betting too hard either way IMO).


