
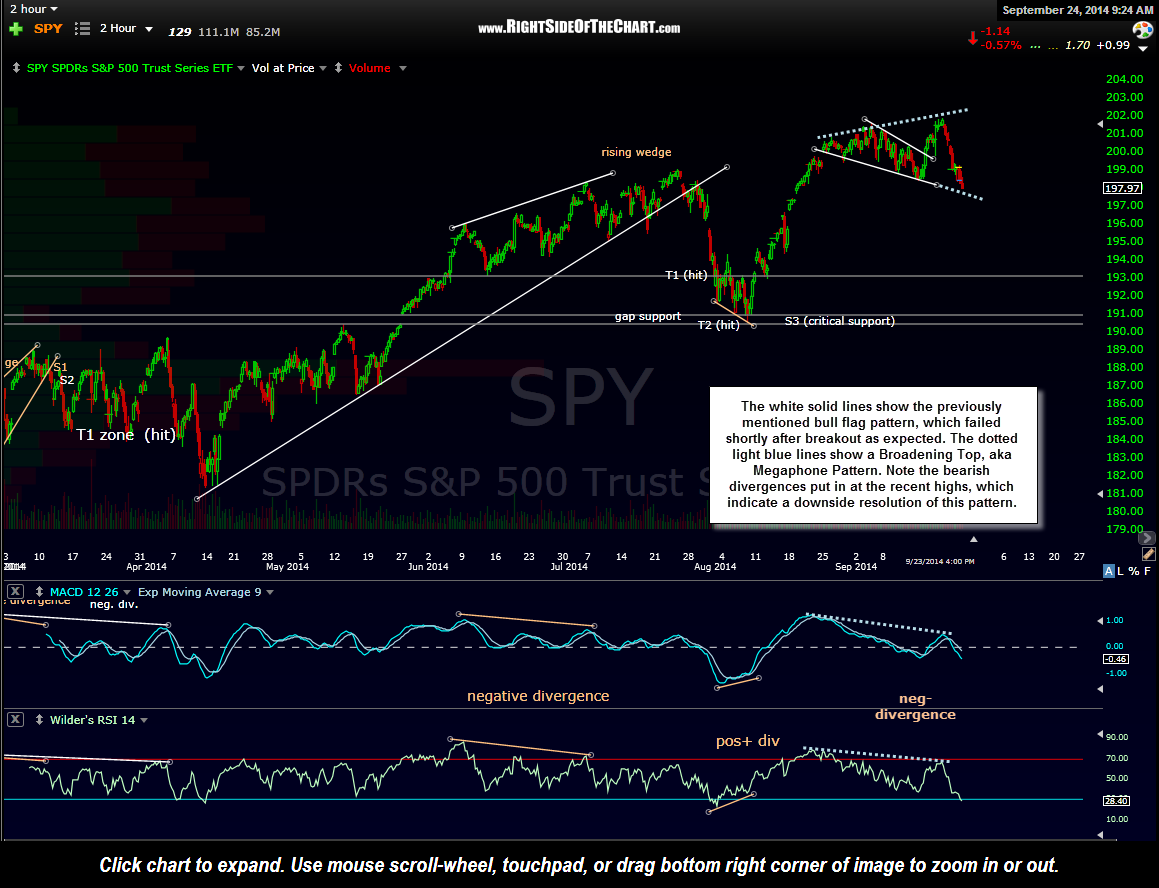
SPY 120 minute Sept 23rd
The white solid lines show the previously mentioned bull flag pattern on the SPY which failed shortly after breakout as expected. The dotted light blue lines show a Broadening Top, aka Megaphone Pattern. Note the bearish divergences put in at the recent highs, which indicate a downside resolution of this pattern shown on this 120 minute chart of the SPY.
With prices closing at the bottom of the pattern yesterday, we may get an early morning bounce following this initial tag. Also keep in mind that the $SPX close right on the major multi-year uptrend line support (from the 2011 lows), which also adds to the case for a bounce off the initial tag of that key daily support level.
Regardless of any short-term bounce that could last minutes, hours, days, or possibly a few weeks although from the looks of the charts, I believe that the US equity markets are currently poised for a significant & imminent correction at this time. Several of the US Stock Index charts under the Live Charts page have been updated & time permitting, I plan to publish a video analysis of the US markets later today, possibly tomorrow.