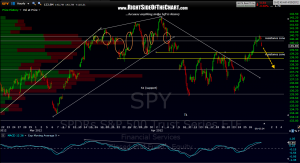
 i often harp on the significance of gaps in trading. last week, i mentioned that my upper resistance zone on the 60 minute SPY chart was comprised of three gaps but that was more of a quick eye-balling reference to how the top of that resistance zone lined up nicely with the top of the 3 very large gaps on that time frame. this updated chart shows that my resistance zone actually includes 7 different gaps in just the last 6 weeks. so far prices turned down off the top of that level on friday and today’s gap down brings the number of gaps included in that zone to 8. if the SPY manages to clearly take this resistance level out then i would say the odds that the market continues to go on to take out the old highs would be pretty good. until then, the near-term trend remains down and the intermediate-term trend will be clear once the SPY either takes out the 4/2 highs (in which case we’ll the short-term, intermediate-term and long-term trends will all be up) or the 4/10-4/23 lows are taken out, changing the intermediate-term trend to down.

