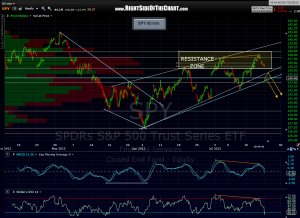
 i’ve added two blue lines to my 60 minute SPY chart; an alternative uptrend line, which i’m sure some traders are watching & trading off of, and a horizontal resistance line, which prices have basically bounced back to after tagging the existing horizontal support line shown here & on my previous charts. i think prices either likely turn back down here or possibly push back up to that primary uptrend line/bottom of the wedge before reversing. therefore, this looks to be about as good an area as any to continue scaling into shorts and/or unloading any remaining longs.

