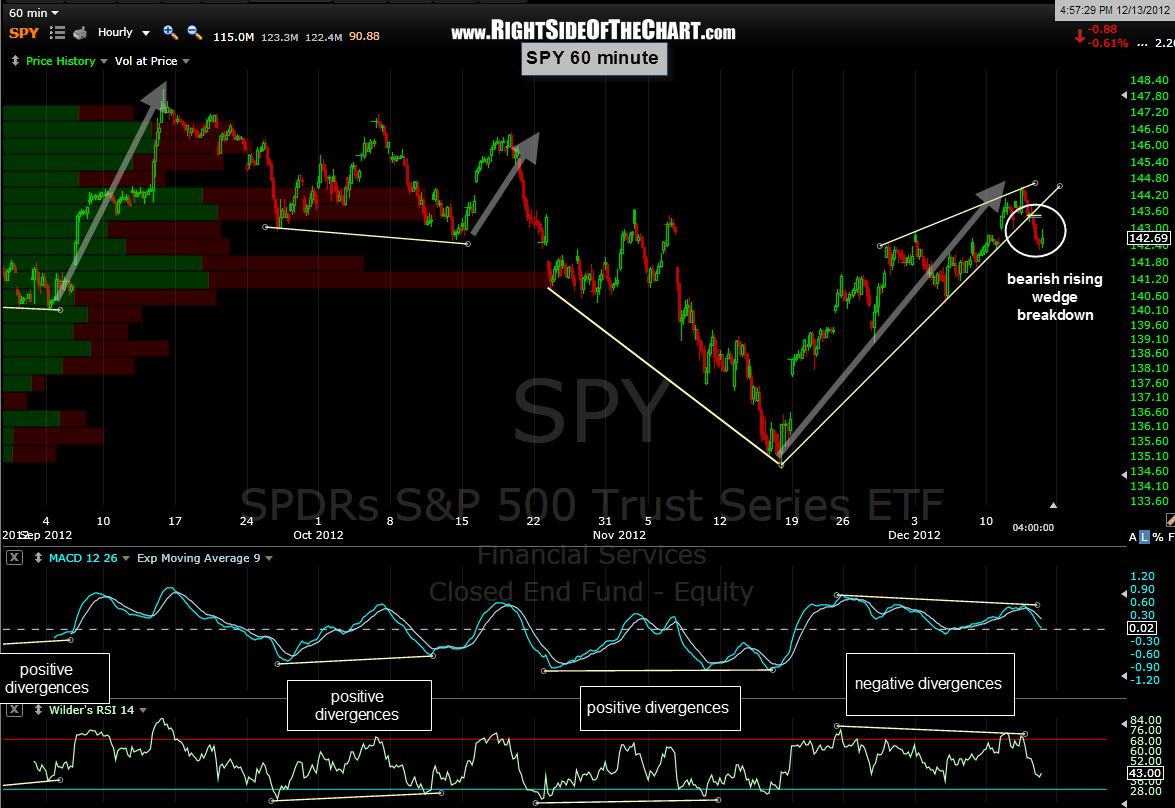
 In the past I’ve talked about how I prefer to see positive or negative divergences in place on the 60 minute time frame when trying to identify a lasting trend reversal. As this 60 minute SPY chart illustrates, today’s drop in the market not only triggered a breakdown of this bearish rising wedge pattern but it also did so with significant negative divergences in place on both the MACD and RSI. Interesting to note that the current negative divergences and price move in the SPY basically mirror the preceding drop on the SPY in both scope and duration. Funny how this 60 minute rising wedge pattern breakdown/sell signal coincided with the bearish confirming candlestick following yesterday’s shooting star although it is anything but a coincidence.
