
 As of the 11:45am ET 15 minute period close, we now have three of the four previously discussed sell signals triggered:
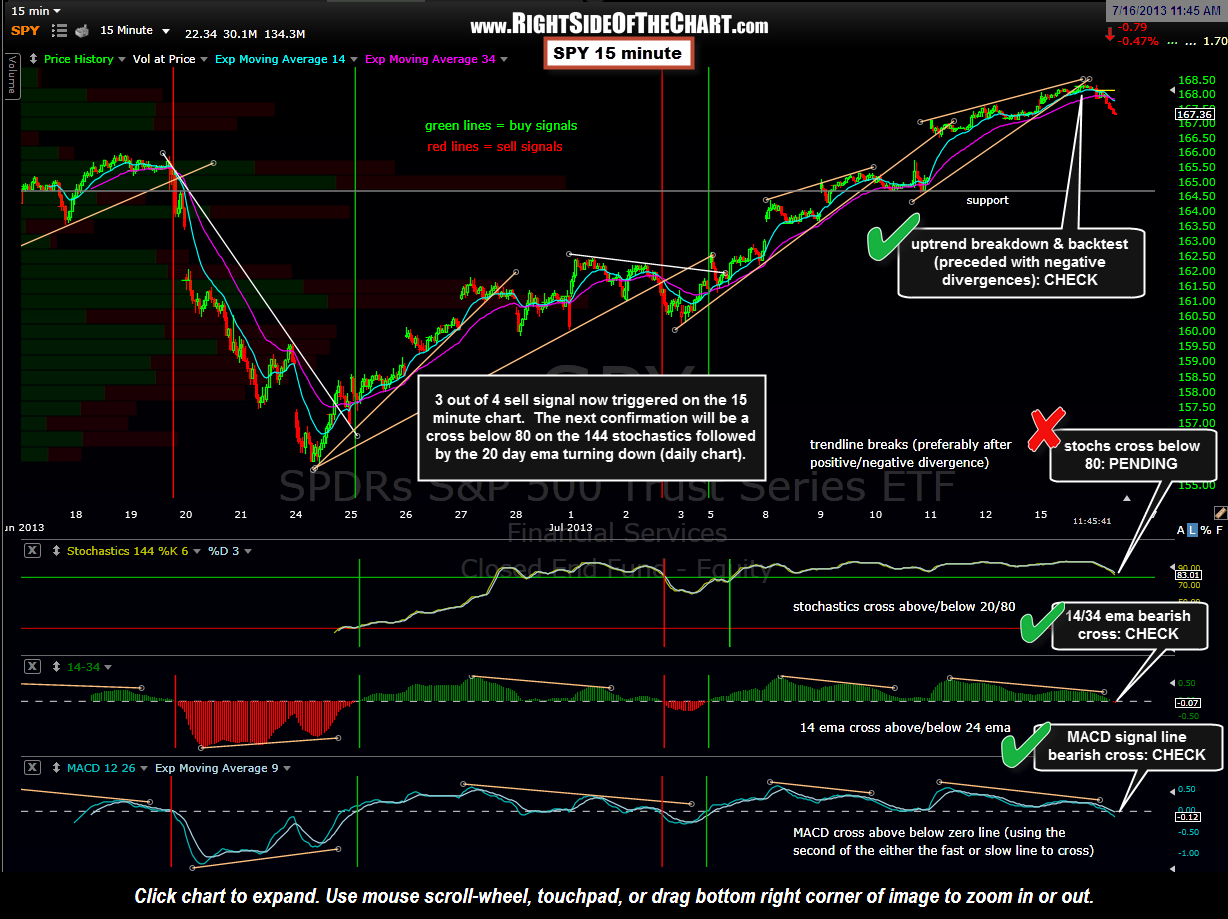
1) The recent uptrend line breakdown & backtest on the price chart.
2) A bearish cross of the 14 ema below the 34 ema.
3) The signal line (9 ema) on the MACD crossing below the zero line (albeit, at the slightest possibly reading of -0.01).
As discussed before, the more sell signals confirmed in close proximity, the better the chances are that a tradeable trend change has taken place. More active, aggressive traders could begin to add short exposure and/or reduce long exposure here based on these signals while less active traders might prefer to wait for additional confirmation via a cross down below 80 on the 144 stochastics and a more solid cross below the zero line on the MACD signal line (the second of the two lines that just barely crossed over). If we do get these additional confirming sell signals, keep in mind that this is only a 15 minute chart and as such, the duration of any move lower could be relatively short-lived. The next sell signal that might indicate additional downside would be the slope of the 20-ema on the daily chart turning down.