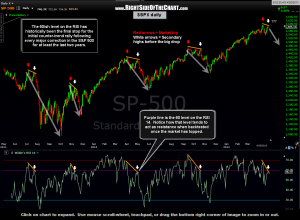
 Mike Kalin had shared this observation that he made with me which I believe warrants passing along. He pointed out a distinct pattern following each significant market peak over the last couple of years. Notice how once the market has topped (red arrows), the RSI fell below the 60 level and typically within a few weeks, came back to test that level from below as prices made a lower high. Historically, those 60ish level backtests proved to be the last objective area to exit any long positions and move to cash or establish a short position before the sharp sell-off began. Only time will tell if we are currently at a similar technical juncture but one might want to keep an eye out for any signs of a technical reversal around these levels. In the first three instances on this chart, the sharp selling began on the initial backtest of the 60 area with only one counter-trend rally to mark a lower high while the last top (Sept 16th) saw a series of two consecutive lower-highs following the top with the first slightly piercing the 60 level and the RSI making a nearly perfect kiss on the second, and final, lower-high.

