
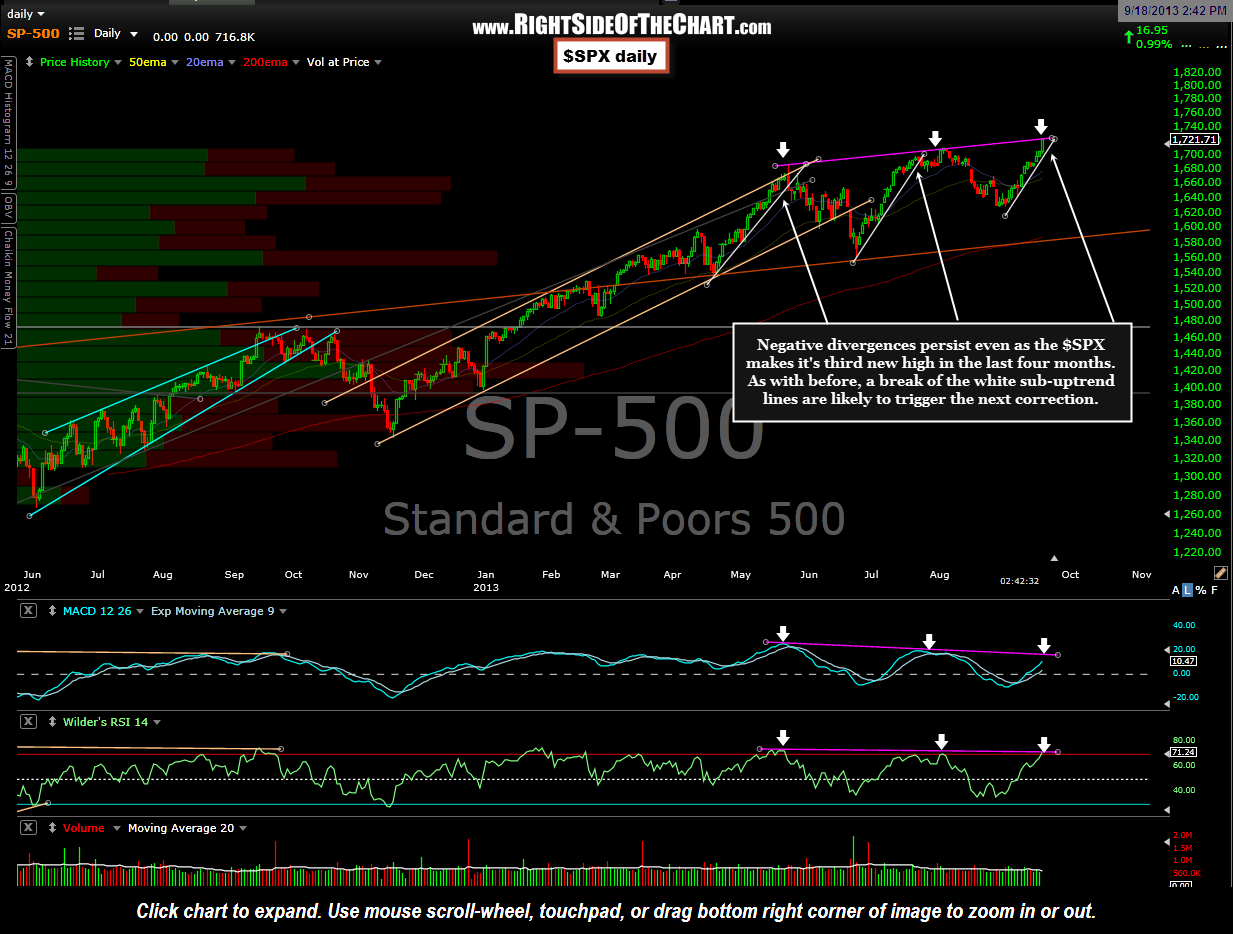
 As is often the case, the market experienced a very sharp reaction following the Fed announcement to hold off the tapering of their bond purchases for the time being. This rip has pushed the $SPX to the third new high over the last four months. As with the previous new high back on August 2nd, today’s new high is also accompanied by clear negative divergences on most indicators and oscillators (MACD & RSI shown on this daily chart). That previous high, as with the May 22nd high before it, was followed by a substantial correction shortly thereafter. Those corrections began following the break of the white uptrend lines shown on this chart.
While the $SPX may continue to build on these gains, possibly even negating these divergences, as long as those divergences remain in place the odds for a correction and failed breakout are elevated. Also keep in mind that it is not uncommon to see the initial reaction follow a Fed announcement to be reversed and then some. Best to wait a few trading sessions to let the dust settle before aggressively adding to any new or existing positions, long or short. Also keep an eye on that latest white uptrend line as a break below will likely trigger the start of the next correction. More updates on the broad markets, metals & miners & some of the other active trades currently listed on the site will follow over the next few days with some new trade ideas to follow over the weekend.