
SPG (Simon Property Group) may or may not need another thrust down within this bullish falling wedge pattern before breaking out above the pattern. This REIT is on watch as a potential Swing Trade + Growth & IncomeTrade with an entry trigger TBD although I wanted to pass along the idea in advance for those interested. Daily chart below:

SPG daily March 29th
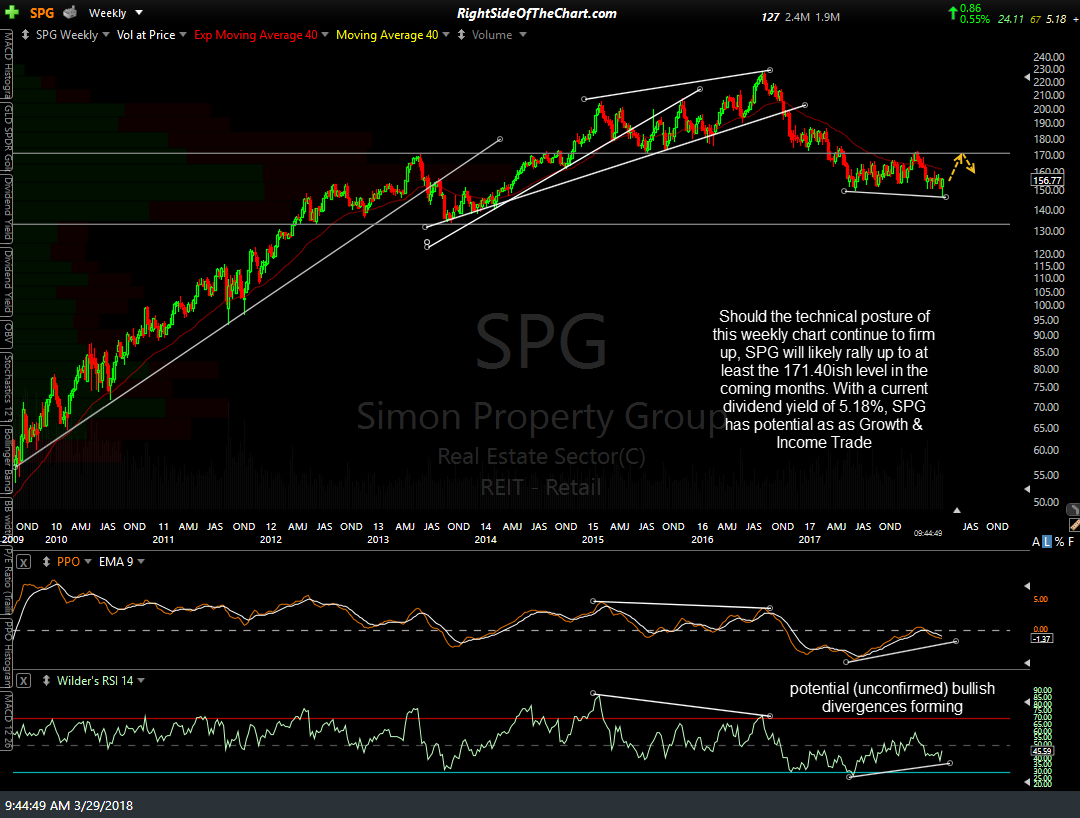
Should the technical posture of this weekly chart continue to firm up, SPG will likely rally up to at least the 171.40ish level in the coming months. With a current dividend yield of 5.18%, SPG has potential as as Growth & Income Trade idea.
SPG weekly March 29th
Note: In the previous post on the CVS trade setup, the weekly chart was not included when the post was sent by email. It has since been added to that post & can be view on the site.