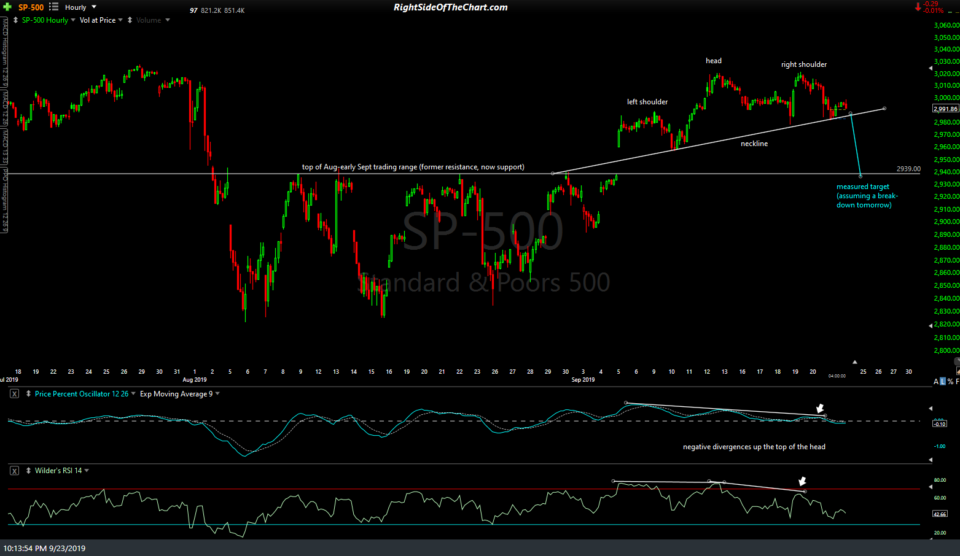
As I like to say, any bullish or bearish chart formation is simply a potential buy or sell signal, awaiting a trigger via a breakout above or below the pattern so while I’m still waiting to see whether or not we get a sell signal via a breakdown below the neckline of that Head & Shoulders topping pattern that I’ve been monitoring on /NQ (Nasdaq 100 futures) since last week, it is also worth highlighting the fact that the $SPX (S&P 500 index) also has a very symmetrical Head & Shoulders pattern on the 60-minute chart as well. In fact, should the $SPX trigger a sell signal on a break below the neckline of that pattern tomorrow, the measured target for the pattern (distance of the neckline subtracted from the point of the breakdown) happens to measure almost exactly to my near-term downside target of 2939, which is the top of the August to early Sept trading range.
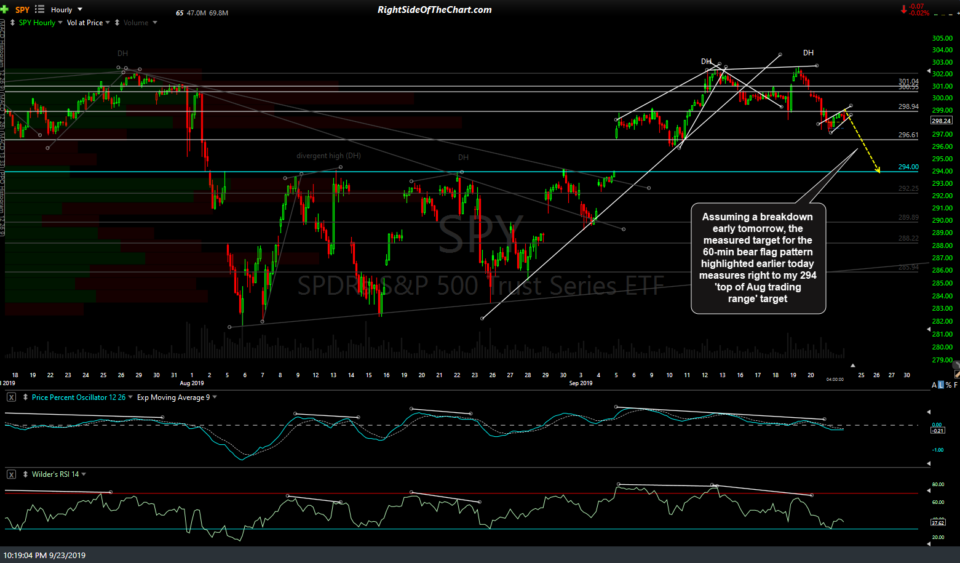
Coincidentally (or not, in my opinion & experience), the measured target for the bear flag continuation pattern that I had highlighted in today’s closing market wrap video also comes in right at the comparable 294.00 support level on SPY, which is the top of the Aug-early Sept trading range as well.
First things first, and that would be a breakdown which, ideally, would come on a gap down at the open tomorrow and/or a move down below the neckline & bear flag shortly after the open. Otherwise, these might simply remain untriggered bearish patterns or they might trigger a sell signal later in the week, in which case the measured targets for the H&S pattern would be have to be recalculated while the bear flag would likely be invalidated.


