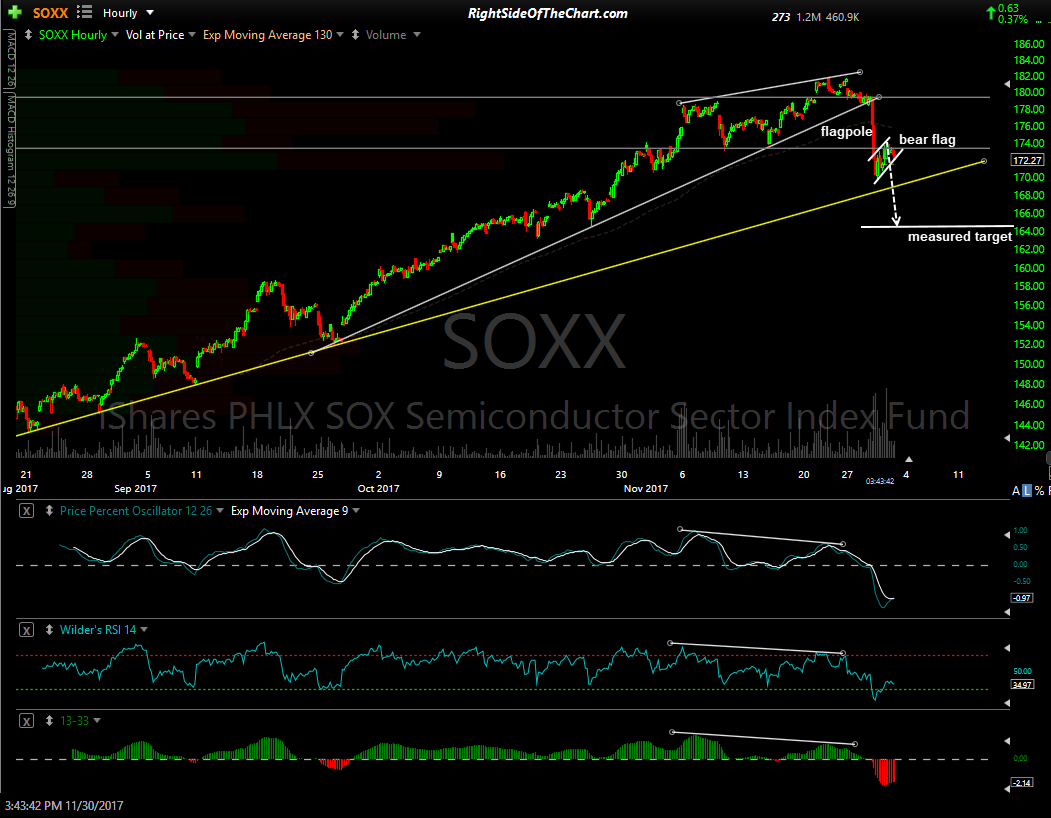
SOXX (iShares PHLX SOX Seminconductor Index ETF) has formed a textbook Bear Flag continuation pattern following the recent breakdown & impulsive thrust down below the 60-minute bearish rising wedge pattern first highlighted here in Monday’s Semiconductor Sector Analysis video. On watch for an break below the bear flag followed by impulsive selling. Should that occur, the measured target (distance of the flagpole subtracted from the highest point of the flag) for the pattern measures to around 164.80. Previous & updated 60-minute charts:
-

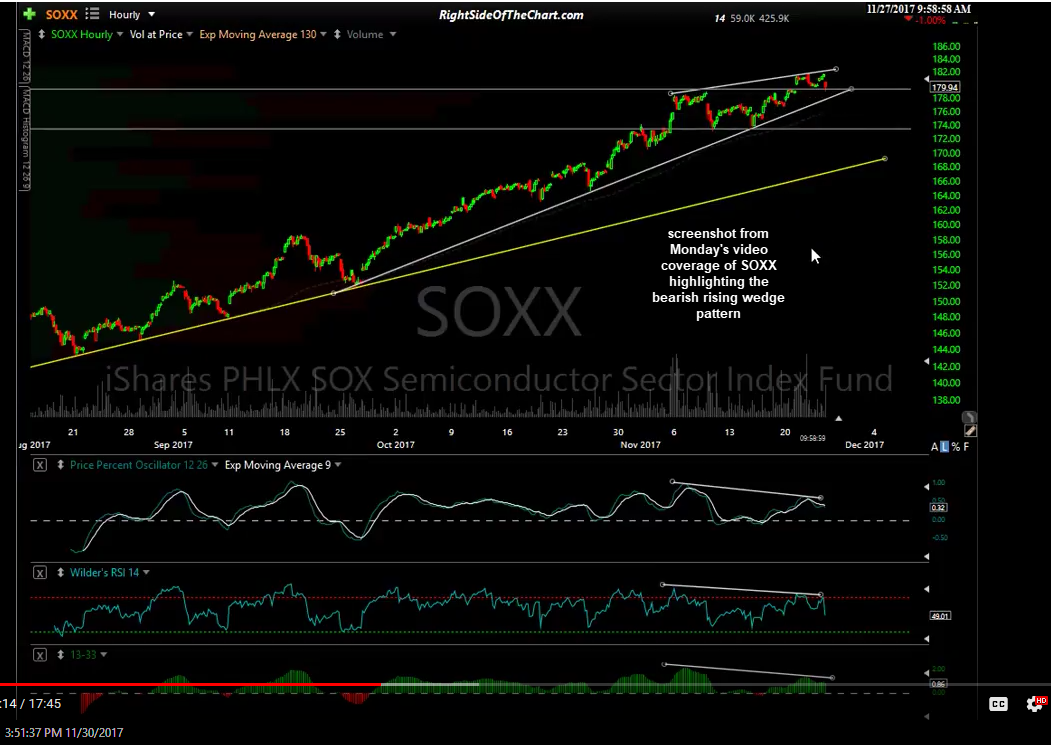
- SOXX 60-min screenshot Nov 27th
-

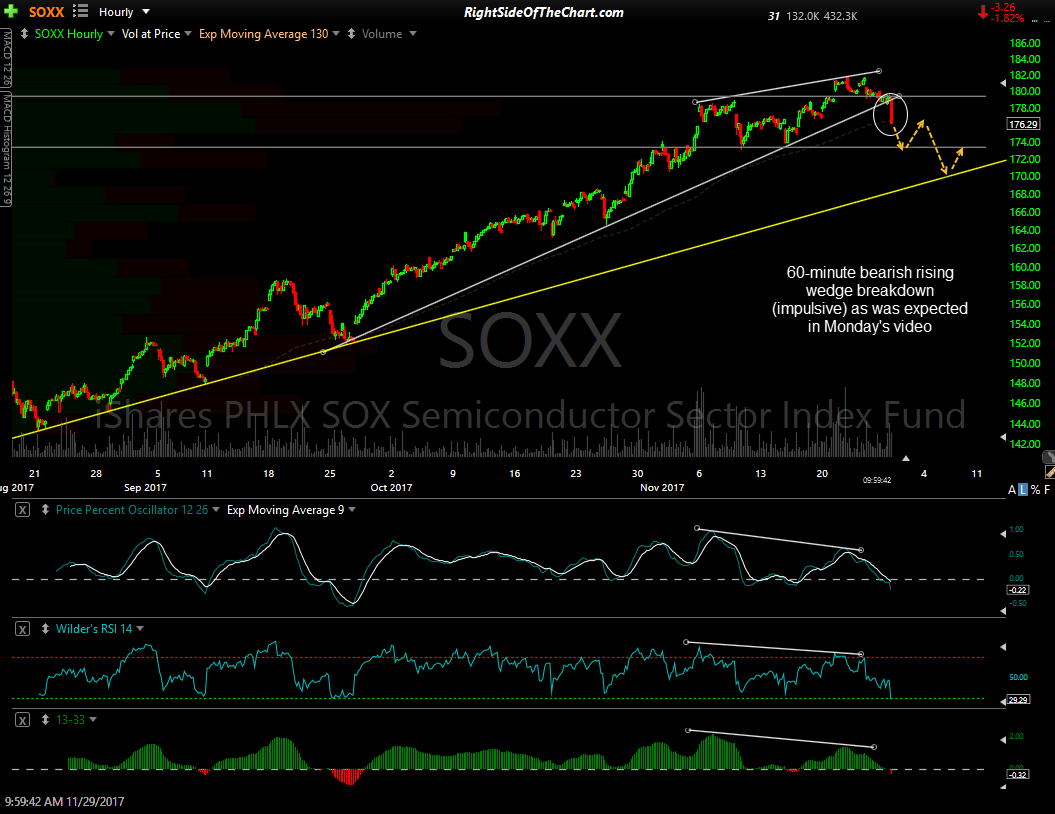
- SOXX 60-min Nov 29th
-

- SOXX 60-min Nov 30th