
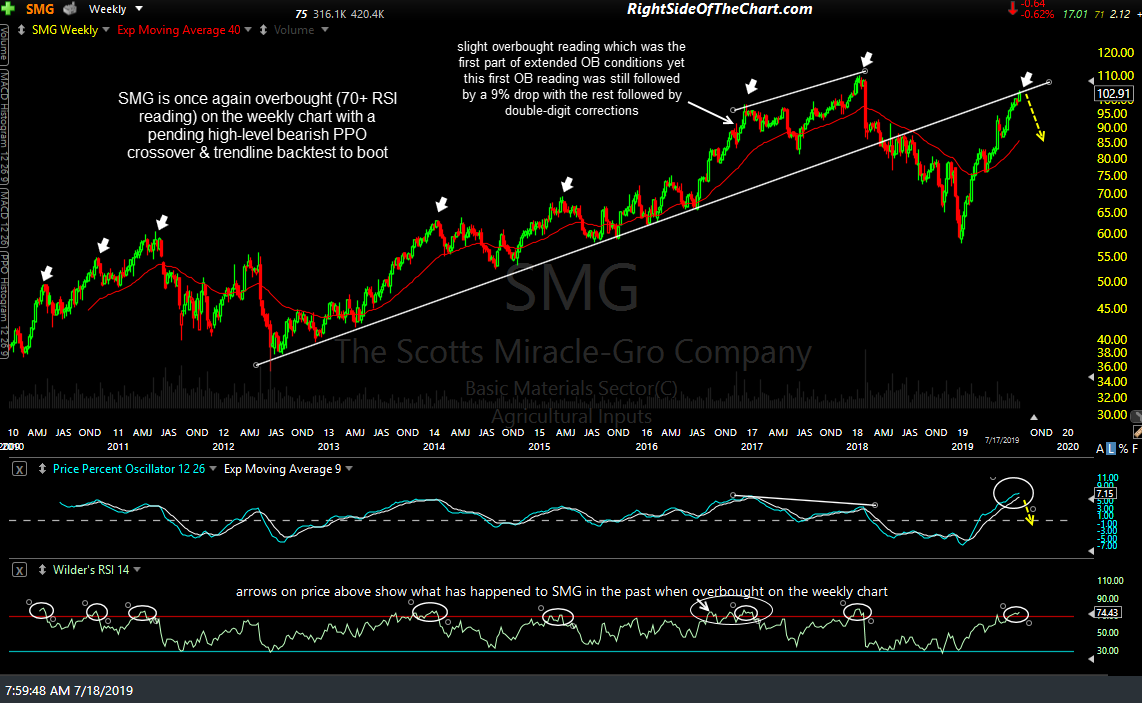
It would be nothing short of a miracle if this 10-year weekly chart of SMG (Scott’s Miracle-Gro Company) doesn’t play out as it repeatedly has in the past. The arrows show all overbought (70+ RSI) readings over the past decade, all of which were followed by double-digit corrections (but the one noted, which was followed by a 9% drop & then another 14% drop shortly after). Additionally, SMG is currently backtesting the primary uptrend line which was broken back in early 2018 along with a pending high-level bearish crossover on the PPO.
SMG weekly July 17th close
Zooming down to the daily chart, SMG is pinching up towards the apex of a dangerously steep & extended bearish rising wedge pattern as it approaches the top of the big early 2018 gap, which should act as a significant resistance level. I went ahead & marked up the price targets & suggested stop for this trade and figured that I’d pass along the setup in advance along I’ll have to wait and see how the stock opens & trades today or going forward before adding it as an Active Trade.

SMG daily July 17th close
SMG is scheduled to report earnings on Wednesday, July 31st before the market opens & while I will often hold of on adding an official trade shortly before they report, due to the increased likelihood of an earnings-induced gap for or against they position, I will most likely add SMG as an offficial trade before then, possibly later today. While I might add this as an official short trade while still inside the wedge, without any sell signals in anticipation of a breakdown that has yet to occur, I will add that the most objective entries would come on either another 4% or so rally up to the 107ish gap resistance and/or an impulsive breakdown below the daily uptrend line/rising wedge pattern.