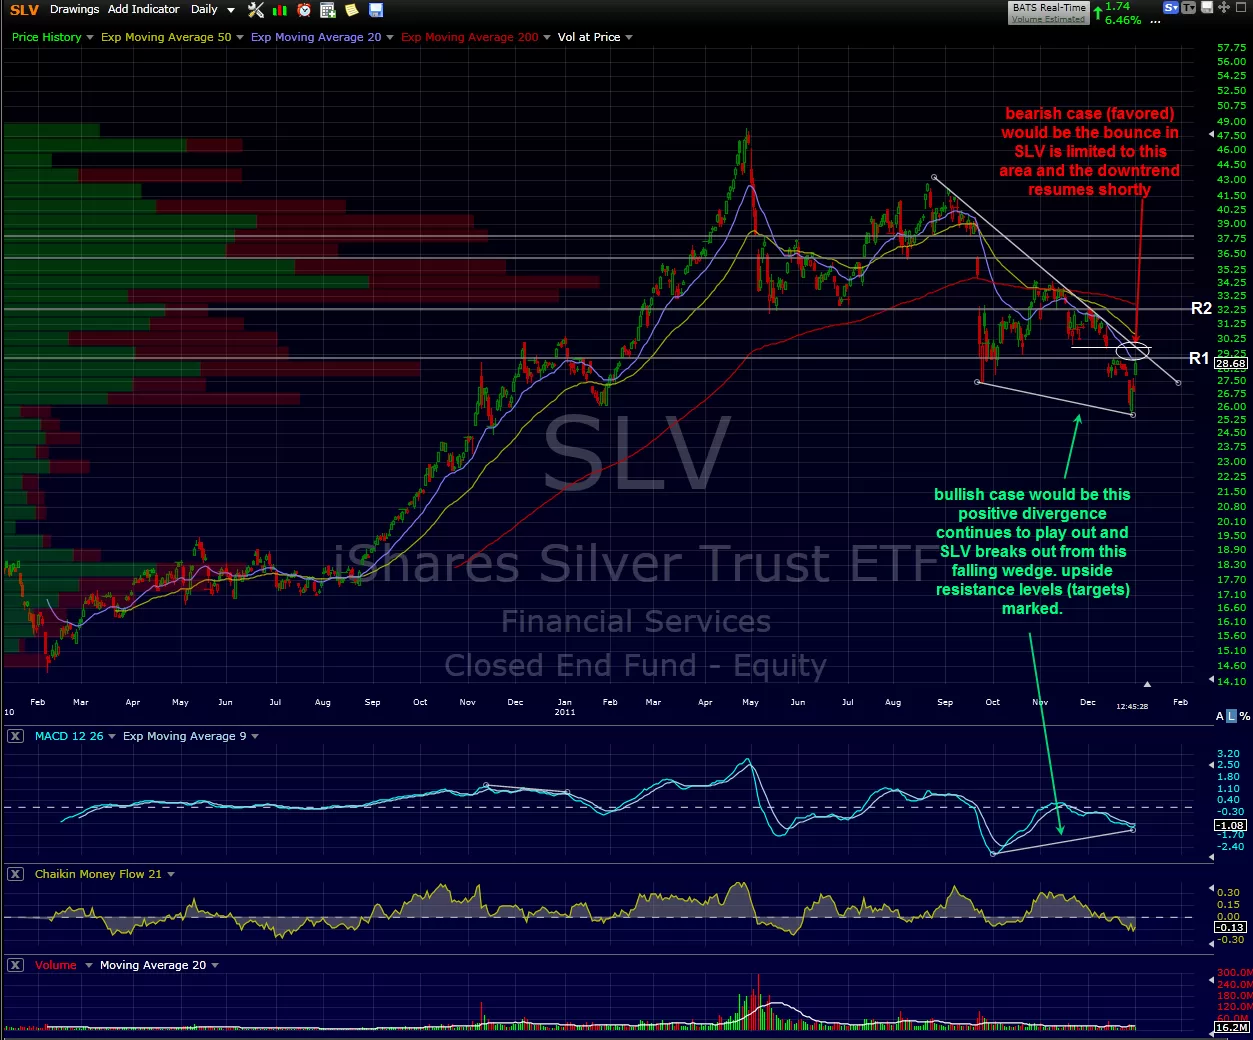
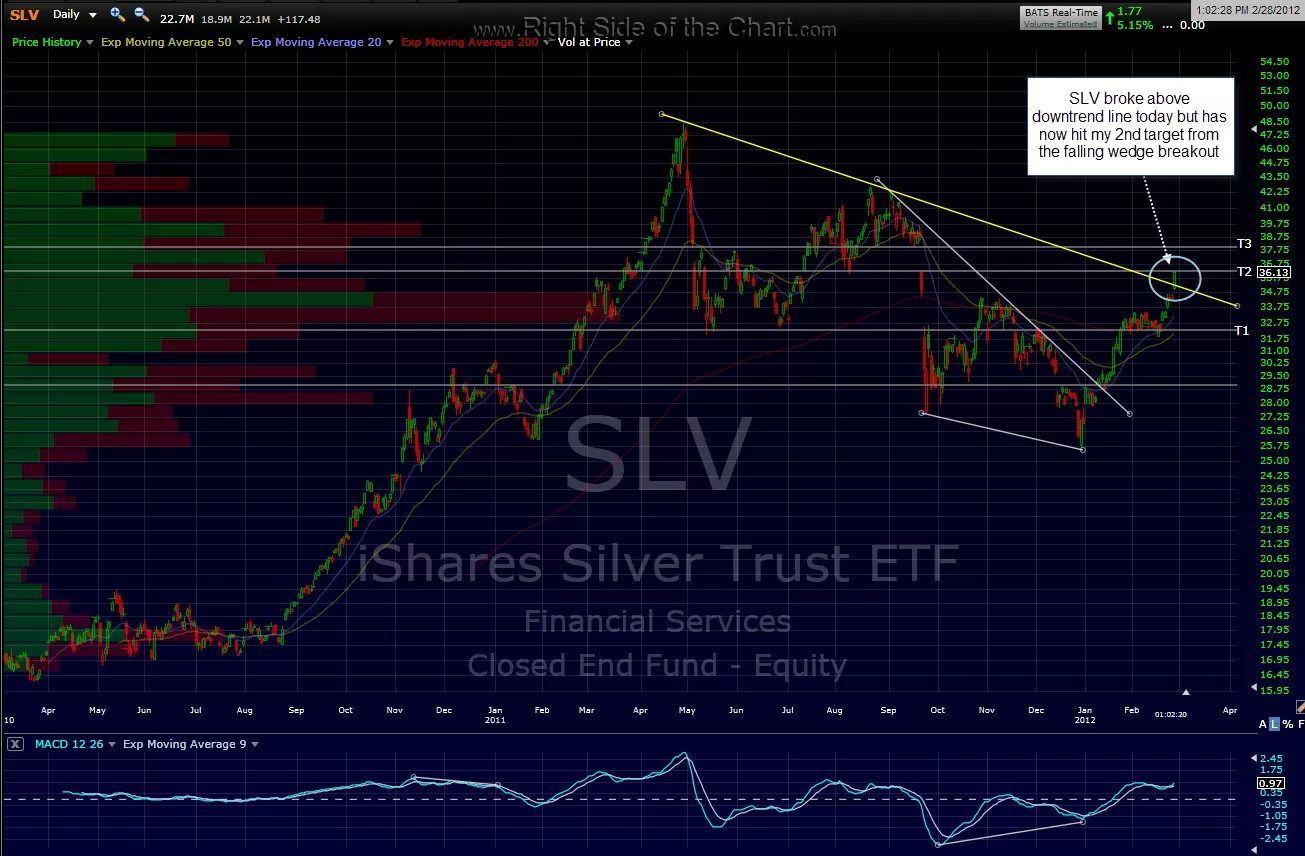
here’s the updated SLV chart along with the previous one’s. i added a yellow downtrend line to today’s chart which you can see that SLV has clearly taken out (bullish). on the other hand, SLV has also now run smack into my 2nd target, so the odds of at least a small pullback or pause here are pretty good. T3 will be my final target but fwiw, I do not have any position in SLV nor do I have a strong opinion on where it goes from here. I just wanted to post the updated charts since this is still an active long trade on the site since the break-out of the falling wedge originally posted back on january 3rd (and broke-out on january 10th). i will update a GLD chart in a few since that trade is still active as well, although on the short-side. (to clarify: when looking at that original chart from jan 3rd, i mistakenly implied that the S1 and S2 levels were also the targets. prices were actually already at S1 at the time, it was merely a level that SLV had to take out to hit the targets above, which were/are the horizontal lines on the chart).

Results for {phrase} ({results_count} of {results_count_total})
Displaying {results_count} results of {results_count_total}