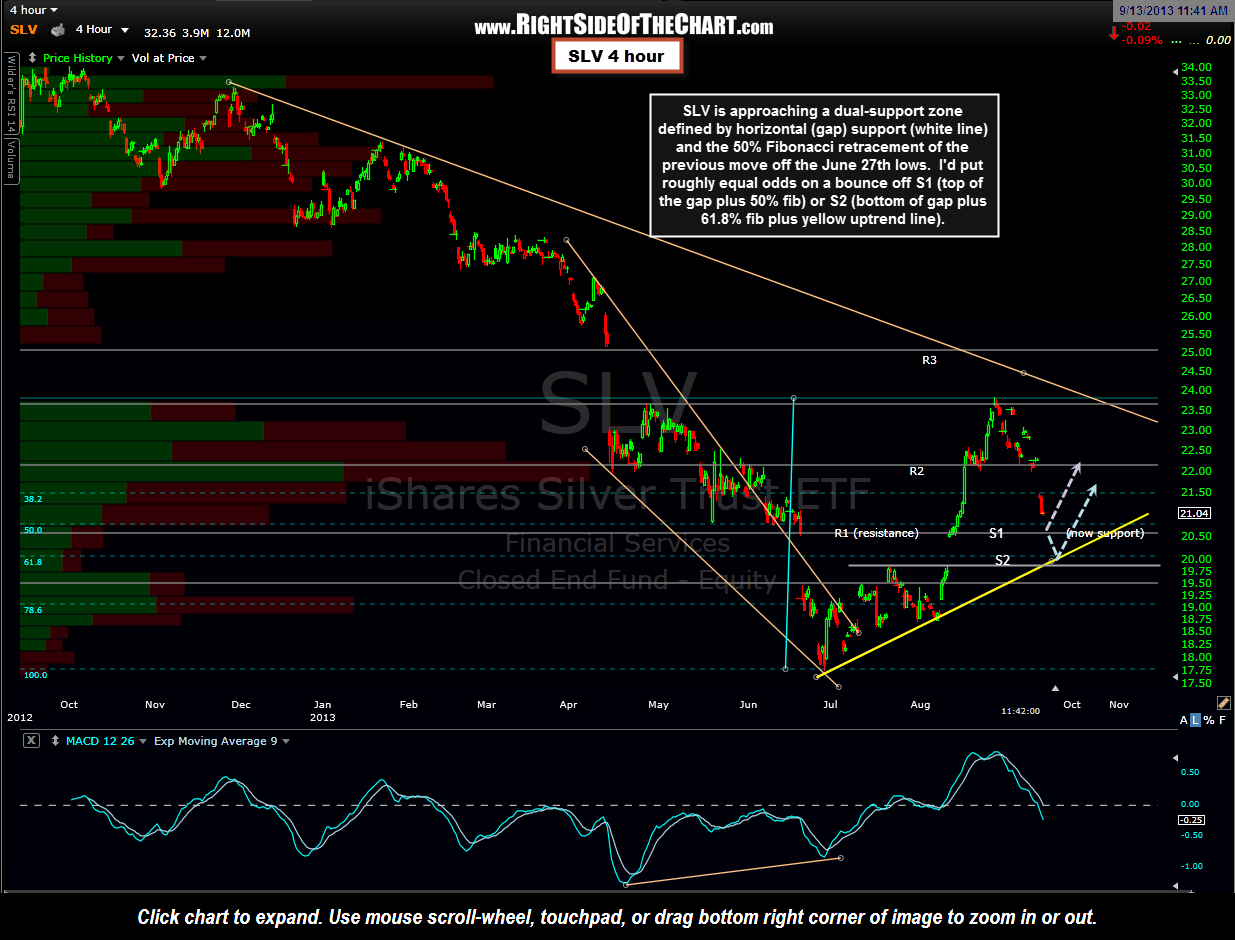
 SLV is approaching a dual-support zone defined by horizontal (gap) support (white line) and the 50% Fibonacci retracement of the previous move off the June 27th lows. I’d put roughly equal odds on a bounce off S1 (top of the gap plus 50% fib) or S2 (bottom of gap plus 61.8% fib plus yellow uptrend line). Also note that when trading the individual mining stocks or their respective tracking etfs, such as GDX and SIL, that one should always keep an eye on the metals themselves, via futures or the tracking etfs such as GLD and SLV. For example, I listed some suggested stops on the recent GDX and SIL longs. However, if either of those trades were to slightly exceed my suggested stop levels while GLD and/or SLV were just above a key support level, such as the S2 level on SLV shown on this 4-hour chart, I would most likely give my position a little more room on the stops, waiting to see if the metals find support on those key levels. Also remember that GLD and SLV and especially the miners have been trading with unusually large volatility over the last several months and so a reduction to below one’s typical position size would be prudent at this time.
