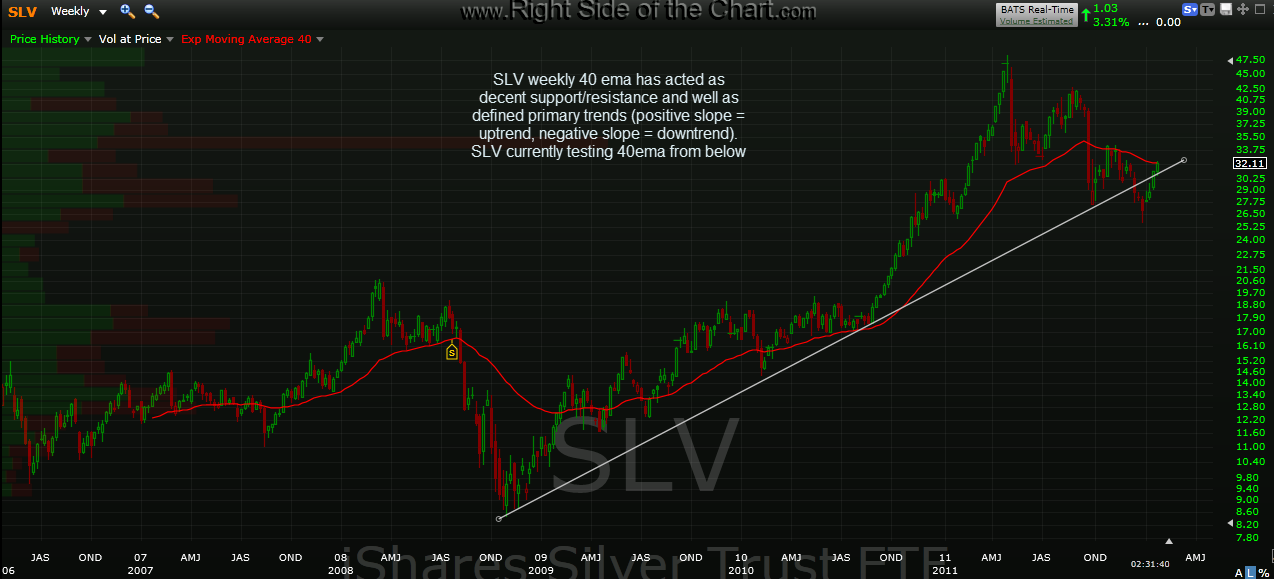
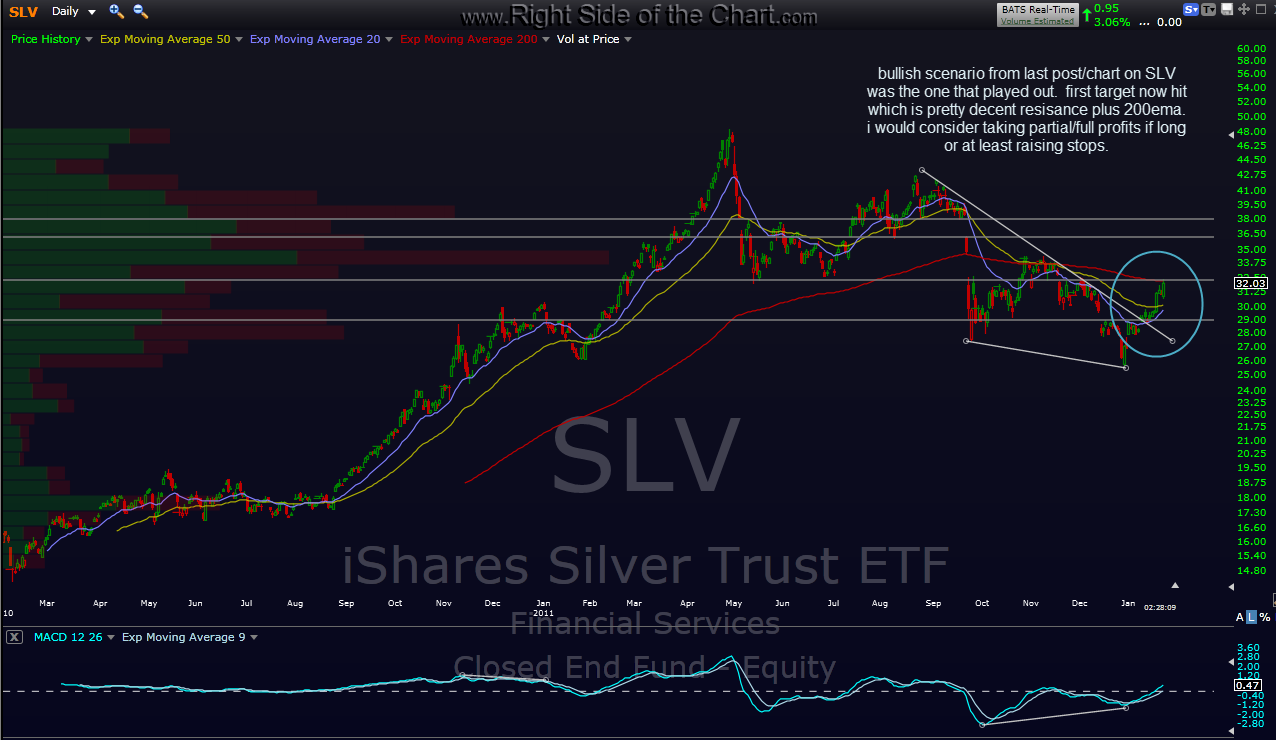
here’s a link to my last post on SLV, with charts and notes. as you can see, the bullish scenario played out and now SLV has hit my first upside target. this resistance level on the daily chart also coincides with potential resistance on the weekly chart so be on the lookout for a potential pullback. of course, a solid move through this level would increase the odds of T2 being hit soon. longs might consider raising stops or booking full/partial profits and maybe look to re-enter if/when this resistance level is cleared. aggressive traders might consider a short entry here with the appropriate stops just north of that level. original charts in link above, updated charts below. remember to click on the chart’s dimensions (blue link) at the top of the image expand to chart to full-size for optimal viewing.