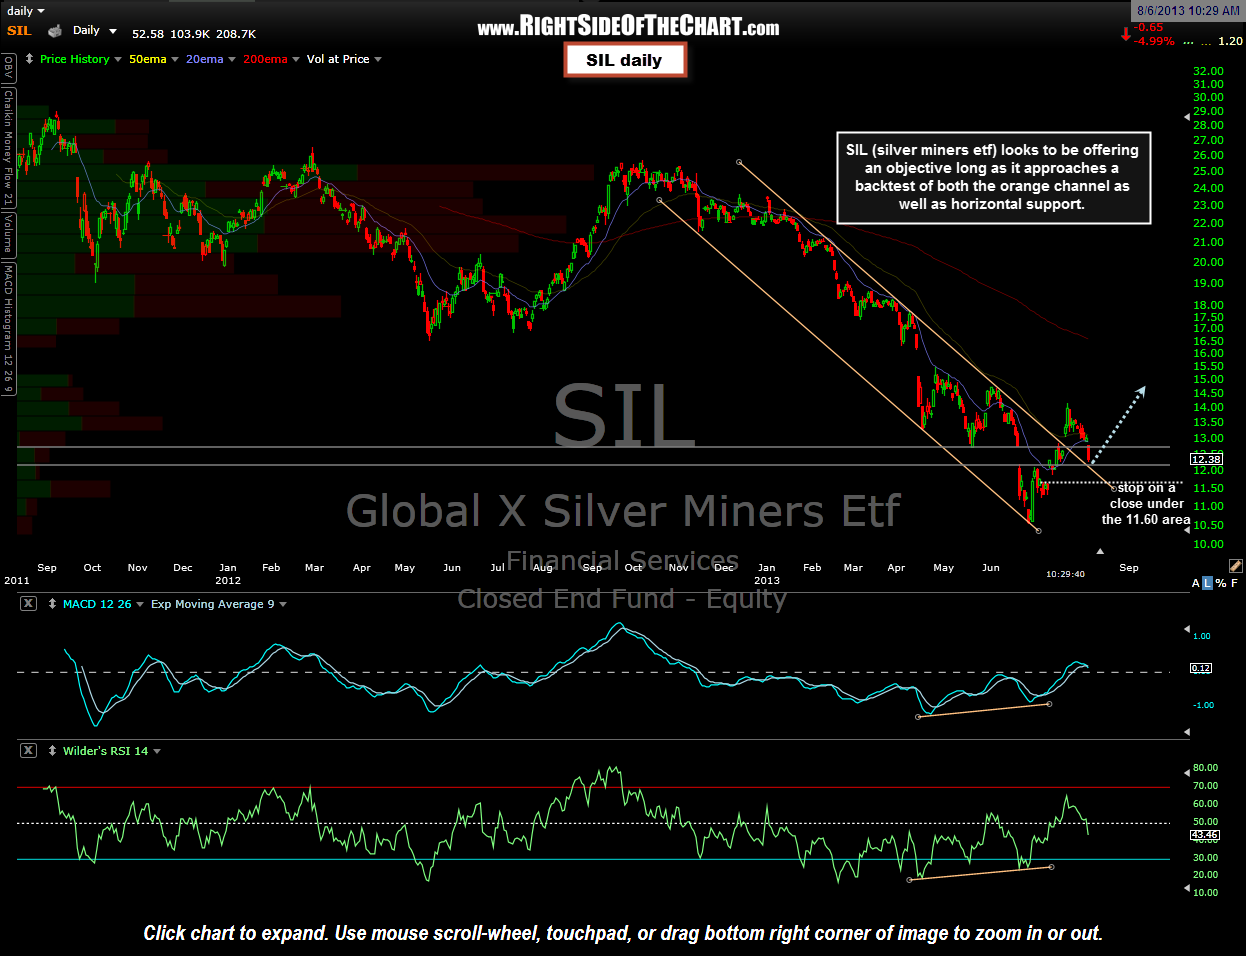
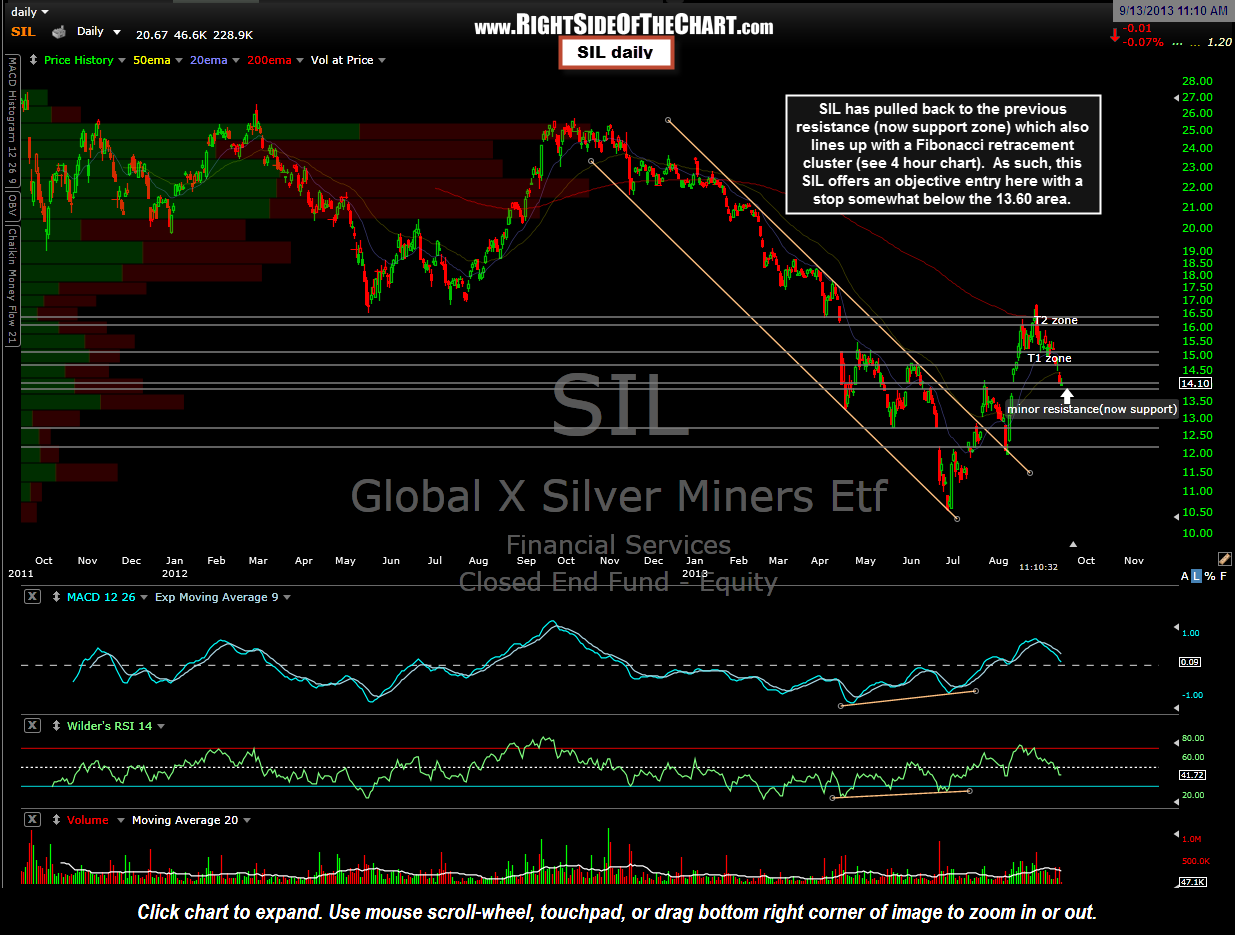
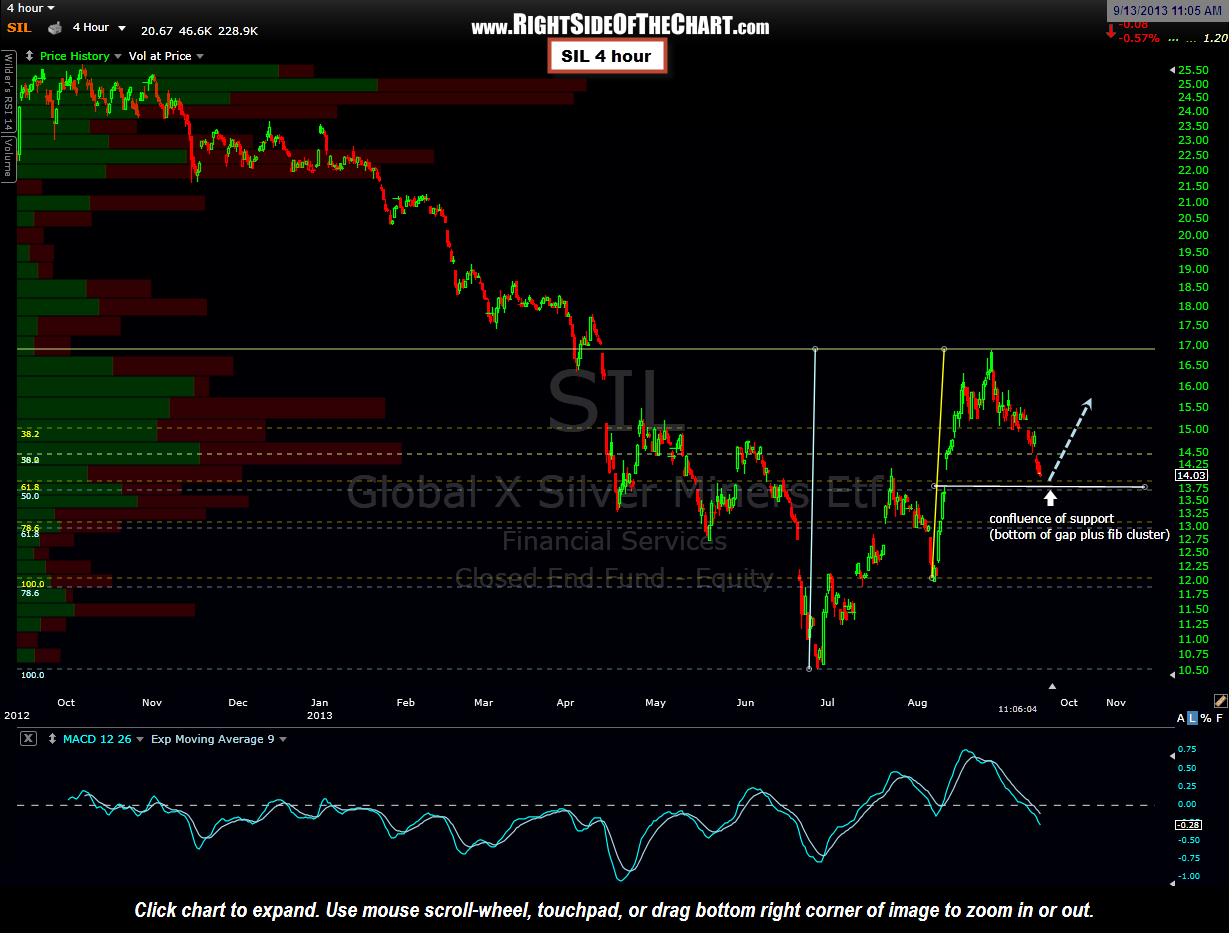
SIL, which was a recent long trade that reversed sharply after hitting the final target, is now approaching a confluence of support defined by the bottom of the Aug 9th-12th gap as well as a Fibonacci retracement cluster (see 4 hour chart below). I’ve included a few of the daily charts from the previous SIL long trade as well as the updated daily chart followed by the 4-hour chart. Prices are still slightly above the top of the support zone so I could easily see a move down to as low as the 13.65ish are before a meaningful reversal in this silver miners etf. However, I’d rather not miss an entry holding out for an extra percentage point or two on my entry so I am establishing an initial position at current levels with a stop not far below the 13.60 area (on at least a 60 minute candlestick close below that level).

Results for {phrase} ({results_count} of {results_count_total})
Displaying {results_count} results of {results_count_total}