In reviewing the Short Trade Ideas today, the following trades have either hit one or more price targets and/or exceeded their maximum suggested stop & will be moved from the Active Trades category to the Completed Trades category.
Note: Additional market & sector commentary, as well as the outlook for these former trades is included in the comments below.
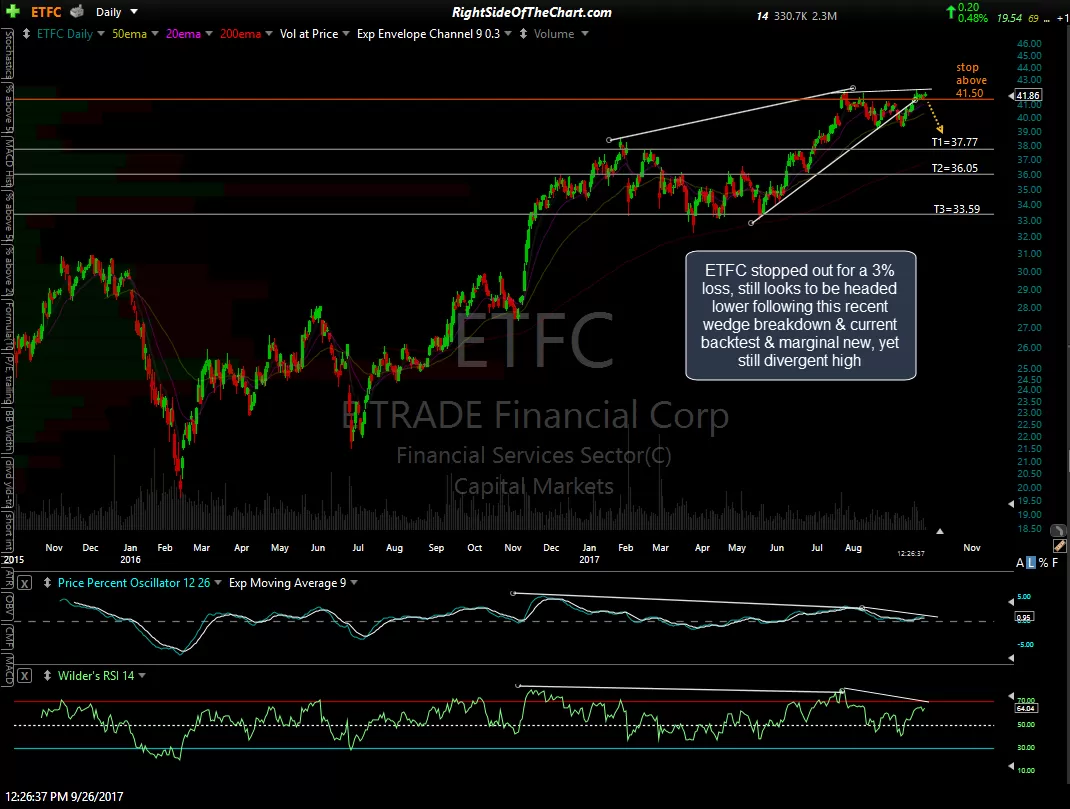
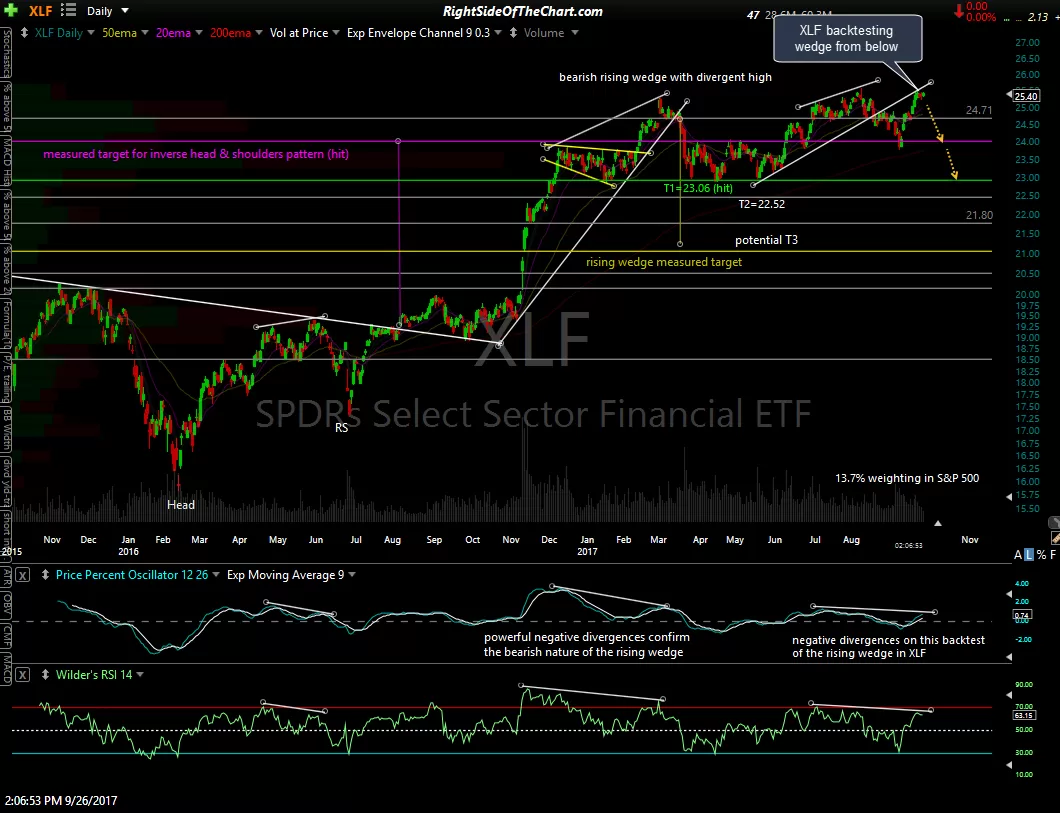
- ETFC exceeded the suggested stop of any move above 41.50 for a 3% loss. After breaking down below the rising wedge pattern, the stock caught a sympathy bid with the rest of the financial sector on expectations of rising interest rates. That rally has brought ETFC up to backtest the wedge from below and from my read on the charts of the financial sector as well as ETFC, which is still only trading less than 1% above the suggested stop, it appears that the rally in the financials, including ETFC, is nearing its end (see XLF chart below).
- FNHC exceed both suggested stops for a 4.6% or 8.9% loss, respectively with the upper-most stop being clipped yesterday.
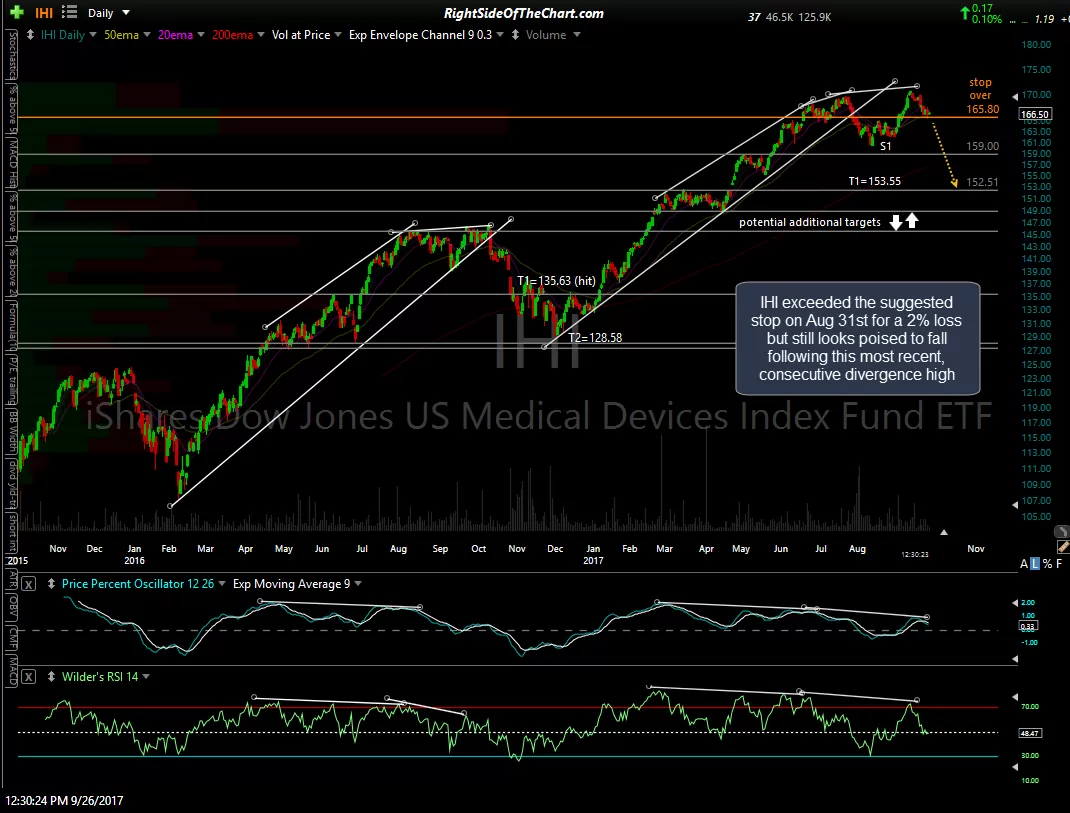
- IHI: The last official short trade on IHI was stopped out for a negligible loss of 2% on Aug 31st although an official update was not posted until now. I still think the medical device sector appears poised for a significant correction, including IHI following the most recent divergent high. However, my preference remains to short the individual medical device companies with the most bearish chart patterns & objective entry levels as covered in this video published earlier today.
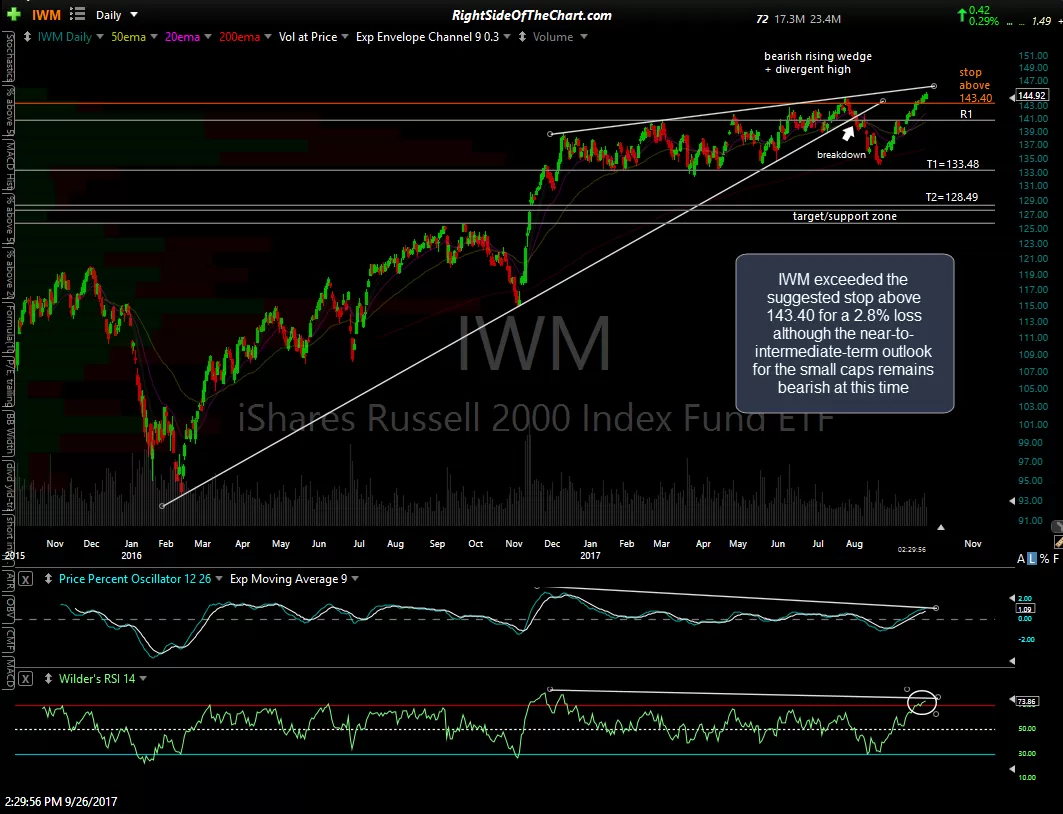
- While IWM offered an objective short entry back on Sept 5th, the small caps went on to catch a bid following the FOMC meeting announcement last week, which induced a rally into financial stocks (largest sector within the Russell 2000/IWM) as well as money flows from large cap tech stocks into small caps. As per my comments above & chart of XLF below, it appears that rally may be close to an end & either way, as the updated chart on IWM below highlights, this most recent marginal new high which has slightly exeeded the suggested stop above 143.40 for a 2.8% loss is just an extension of the previous negative divergences that were already in place at the previous high just before the large rising wedge breakdown occurred.
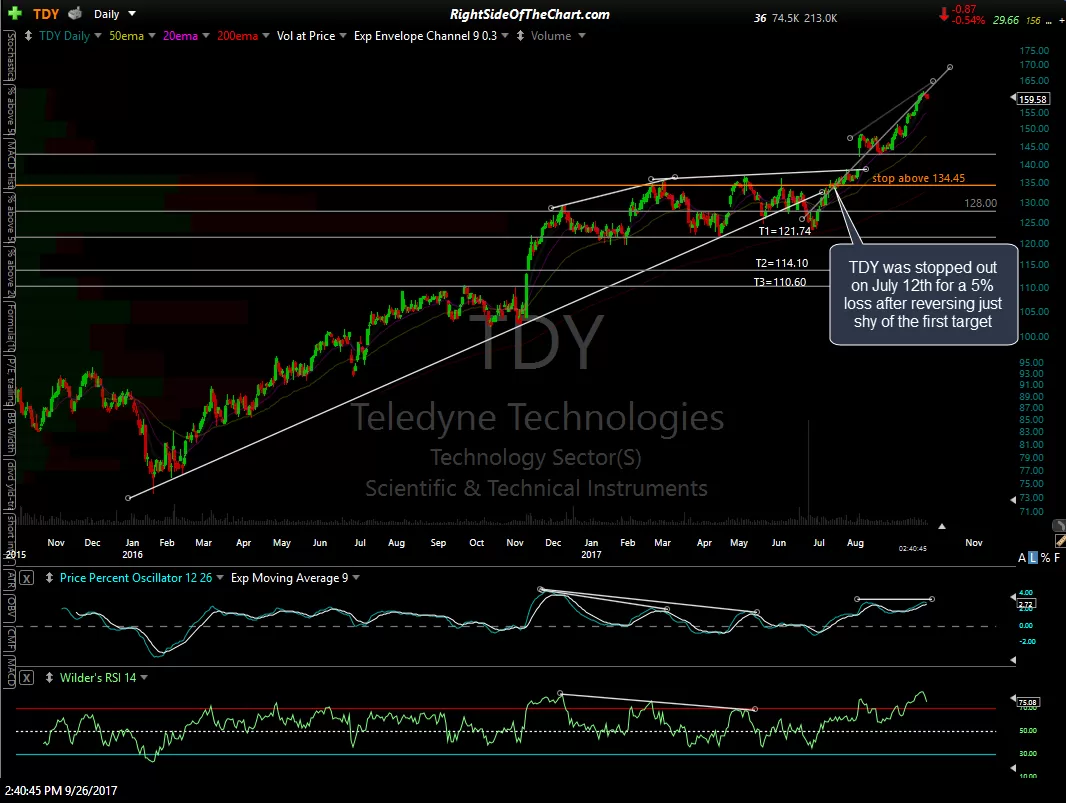
- TDY was stopped out back on July 12th after the trade came within 1% of the first price target before reversing & going on to exceed the suggested stop for a 5% loss.
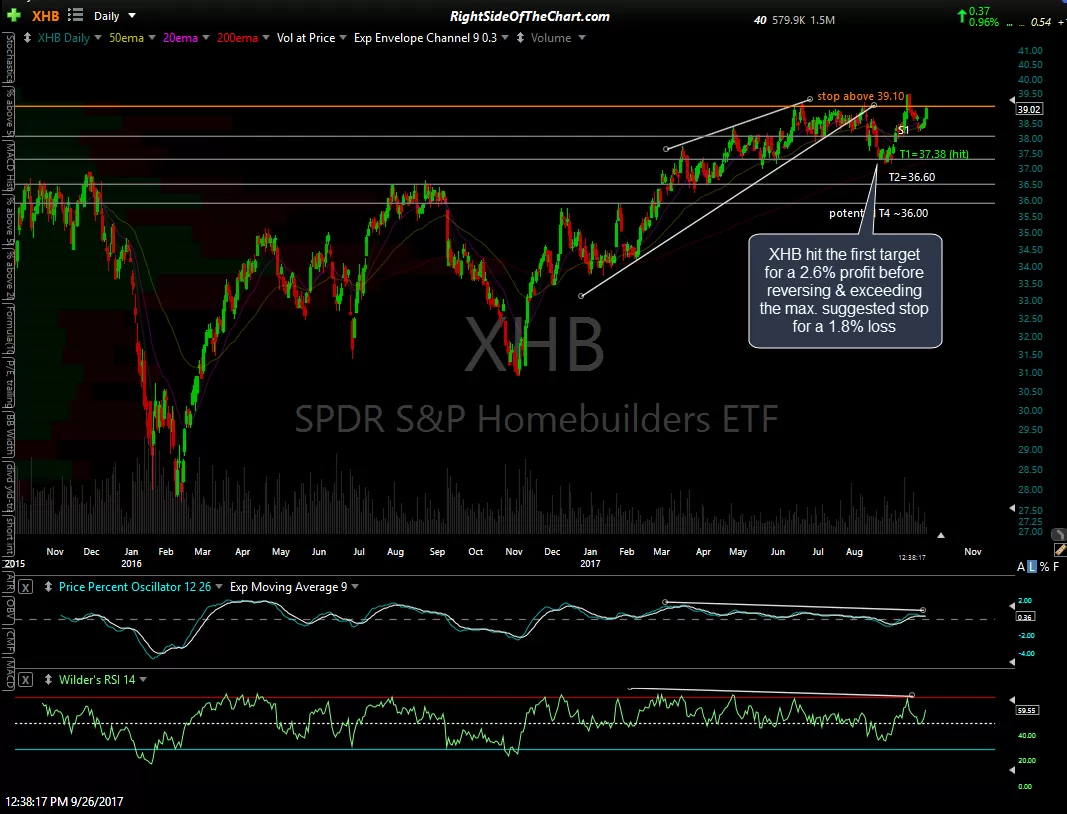
- XHB hit the first price target (37.38) back on Aug 21st for a 2.6% profit, reversing at that support level before going on to exceed the maximum suggested stop of any move above 39.10 on Sept 12th for a loss of 1.8% (for those that did not book full profits at T1).
This market continues to present an unusually challenging trading environment as the trend has been sideways-to-slightly higher for months now on the broad indices & nearly a full year in the small caps (IWM). The recent underlying theme has been one of fairly rapid sector & stock rotation & that is likely to continue to be the case going forward for the foreseeable future. I’ll continue to look for the most promising trade setups, both long & short, in various sector ETFs, commodities & individual stocks while monitoring the major averages for any significant technical developments. The updated charts for each trade below will expand to full size if clicked on. Once expanded, the charts can be panned & zoomed.
-
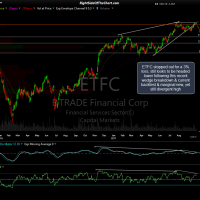
- ETFC daily Sept 26th
-
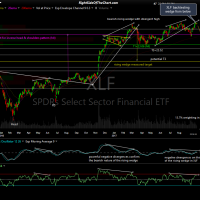
- XLF daily Sept 26th
-
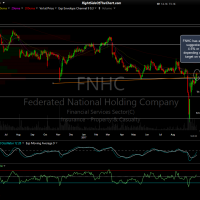
- FNHC daily Sept 26th
-
- IHI daily Sept 26th
-
- IWM daily Sept 26th
-
- TDY daily Sept 25th
-
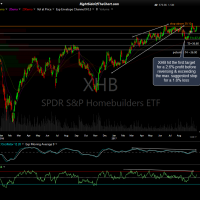
- XHB daily Sept 26th