
Props to member @habadasher0 for bringing this one to my attention. SAVE (Spirit Airlines) has recent reversed off the key $33.00 long-term support level with the RSI at oversold (sub-30) readings on the weekly chart only seen twice before on the stock, both times when SAVE previous fell to the 33 support level & reversing trend and rallying 50%+ from there both times. History doesn’t always repeat but it often rhymes.
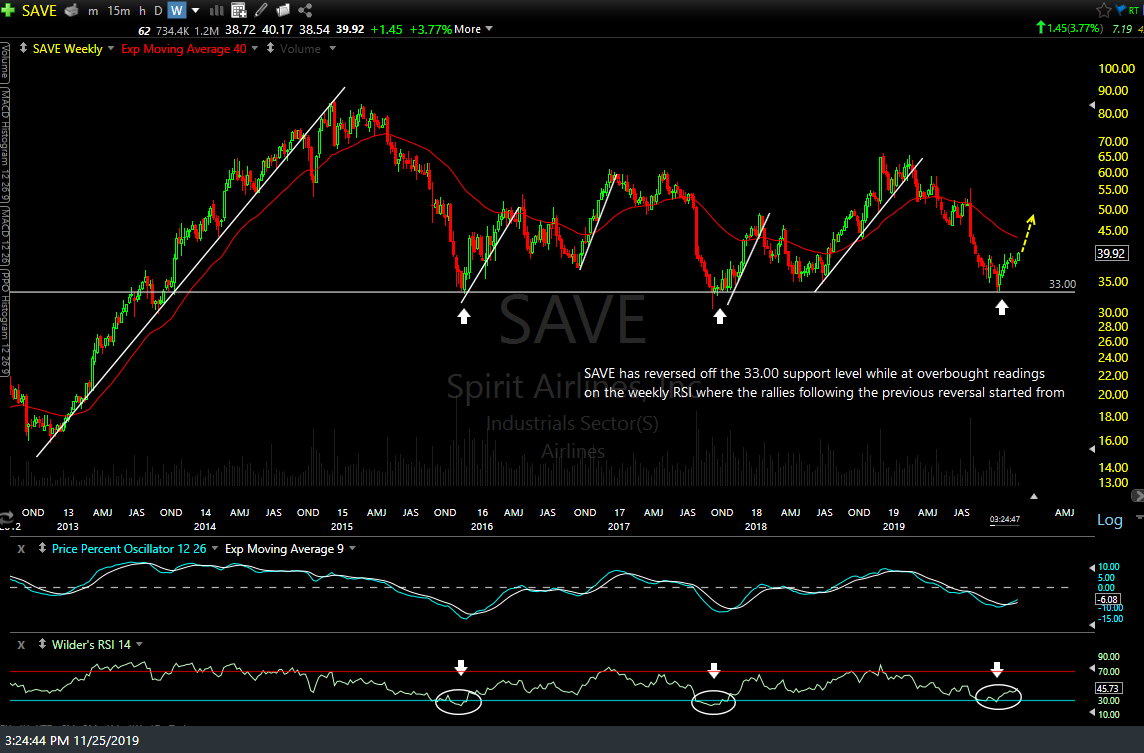
SAVE weekly Nov 25th
On the daily time frame (below), SAVE appears to have just completed the right shoulder of an Inverse Head & Shoulders bottoming pattern with a buy signal to come on a solid breakout above the neckline although I should point out that ideally, a stock should see volume expansion on the final thrust up to form the right shoulder & that does not appear to be the case with SAVE so far.
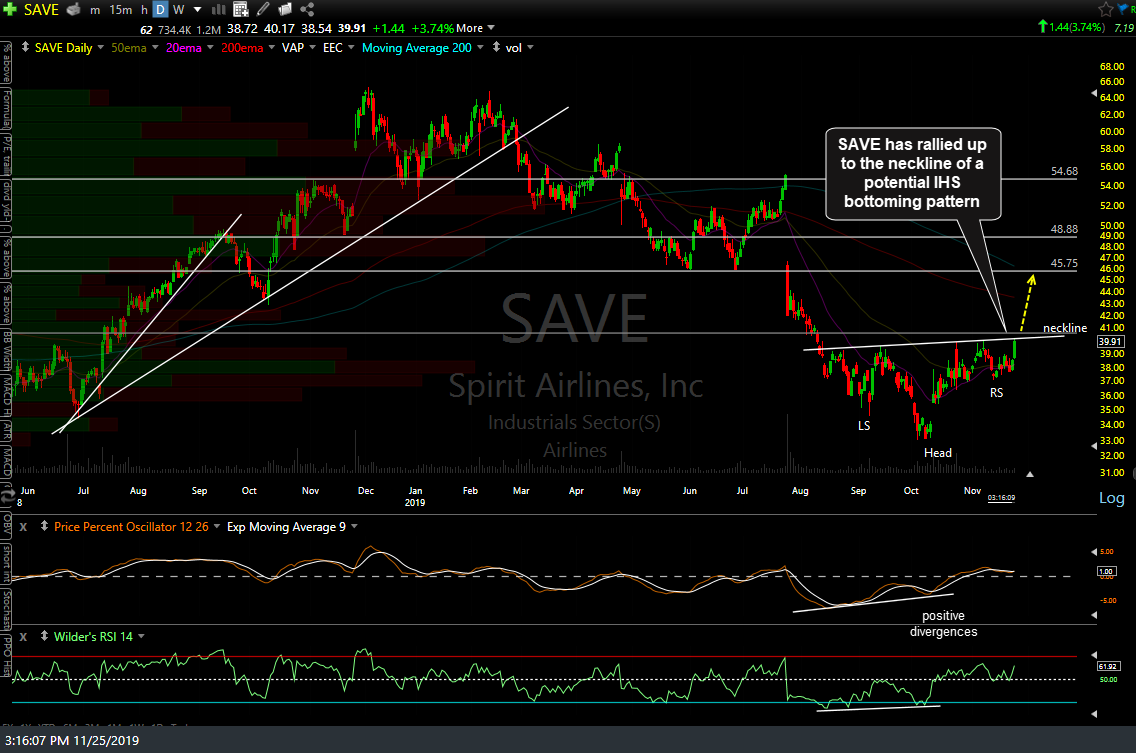
SAVE daily Nov 25th
As my preference is to avoid taken breakouts that occur during the abbreviated & typically low-volume Thanksgiving holiday week due to the elevated chance of whipsaw signals, I’m just passing this along as an unofficial trade idea at this time for those interested although I plan to monitor SAVE & may add it as an official swing trade Setup or Active Trade next week, depending on how things look at the time. Until then, I just wanted to pass along the trade idea for those interested & while I will add exact price targets if & when this becomes an official trade idea, I can say that my first price target will likely be set just shy of the 45.75 resistance level.