
In updating the trade ideas today, SAFM (Sanderson Farms Inc.) will be moved to the Completed Trades archives as the Swing Trade + Growth & Income Trade exceeded the maximum suggested stop of any move below 97.10 on October 12th after hitting the first target for a 5.3% profit & reversing from there.
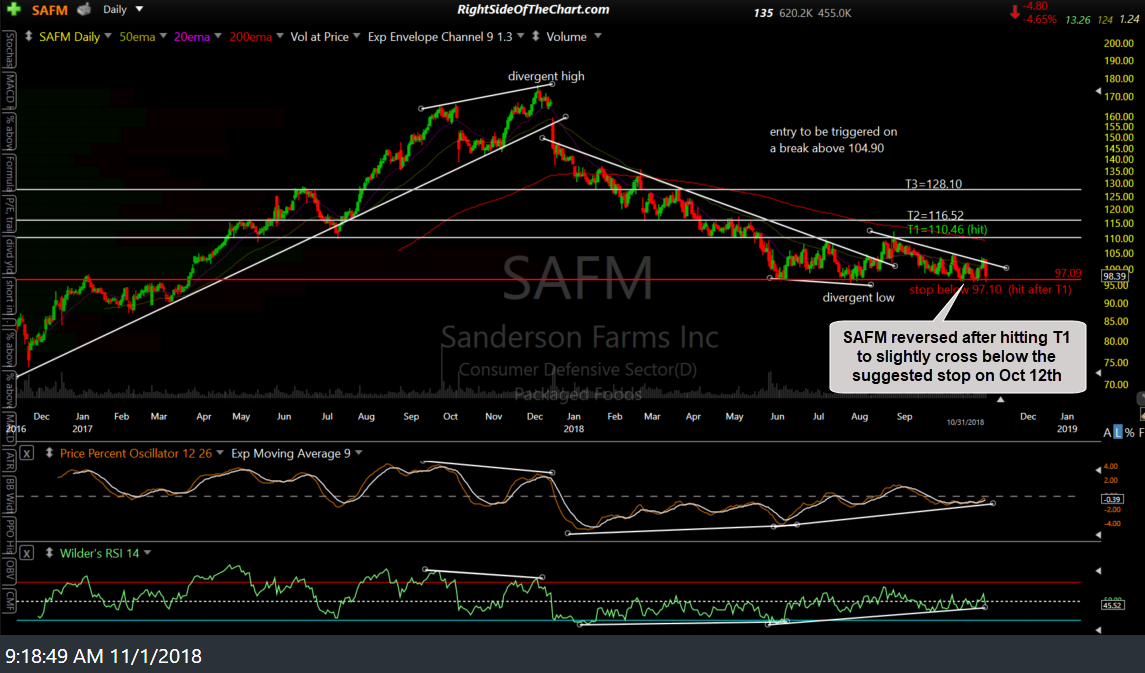
SAFM daily Oct 31st close
As the weekly & daily charts on Sanderson Farms remain constructive, this dividend-paying stock is on watch for another potential official trade idea. The next objective entry might come on a break above the most recent downtrend line or possibly on a brief undercut & flush-out move down below the 97ish key support level and/or a subsequent recovery back above that level.
Such a wash-out move, if followed by a recovery back above that key support level would have the potential to be a bear trap, with longer-term bullish implications for the stock. As of now, I would prefer to see how both SAFM & the broad market trades so this is only a potential trade setup at this time.
The loss on this trade for those that didn’t book partial or full profits and/or raise stops when T1 was hit, as suggested at the time, was 7.2%. That figure takes into account the 0.32 dividend that was paid out to shareholders of record as of October 2nd, which reduced the cost basis on this trade from the original entry price of 104.91 down to an adjusted basis of 104.59.