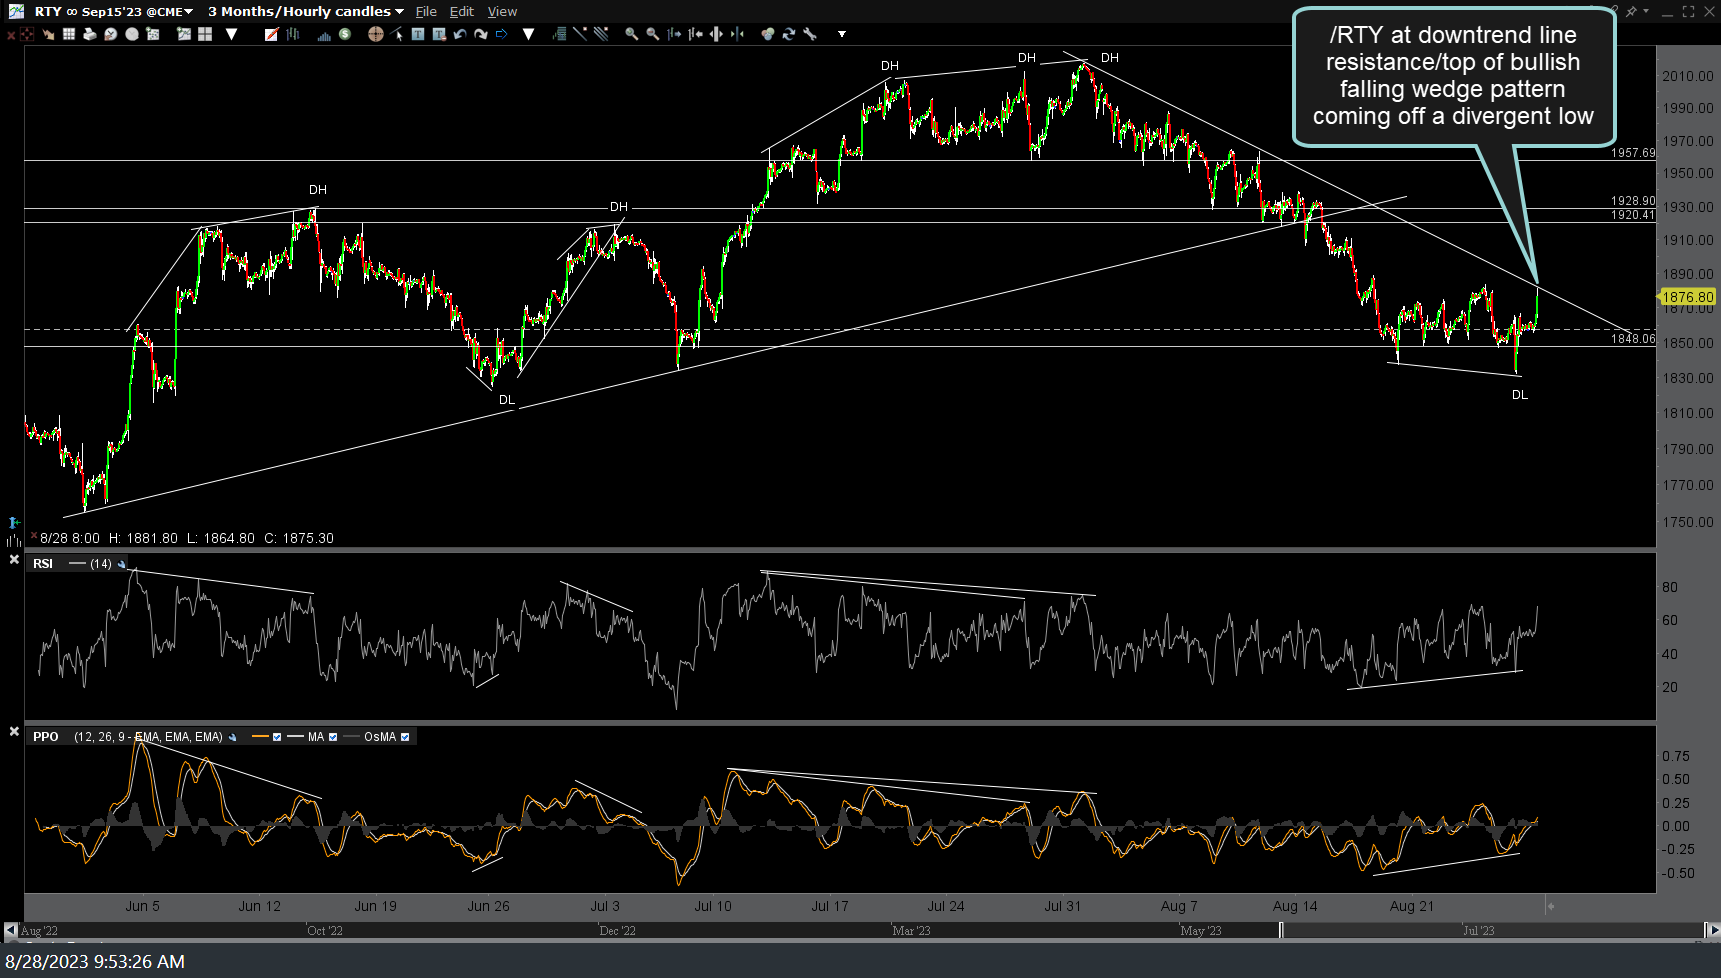
/RTY (R2k Small-cap Index futures) is currently trading at downtrend line resistance which also forms the top of bullish falling wedge pattern, while coming off a divergent low. While a reaction here would help to validate that downtrend line (likely IMO), a solid break above could spark a rally unless the large-caps begin to take another leg down soon. 60-minute chart below (IWM is the ETF counter-part for the Russell 2000 index).
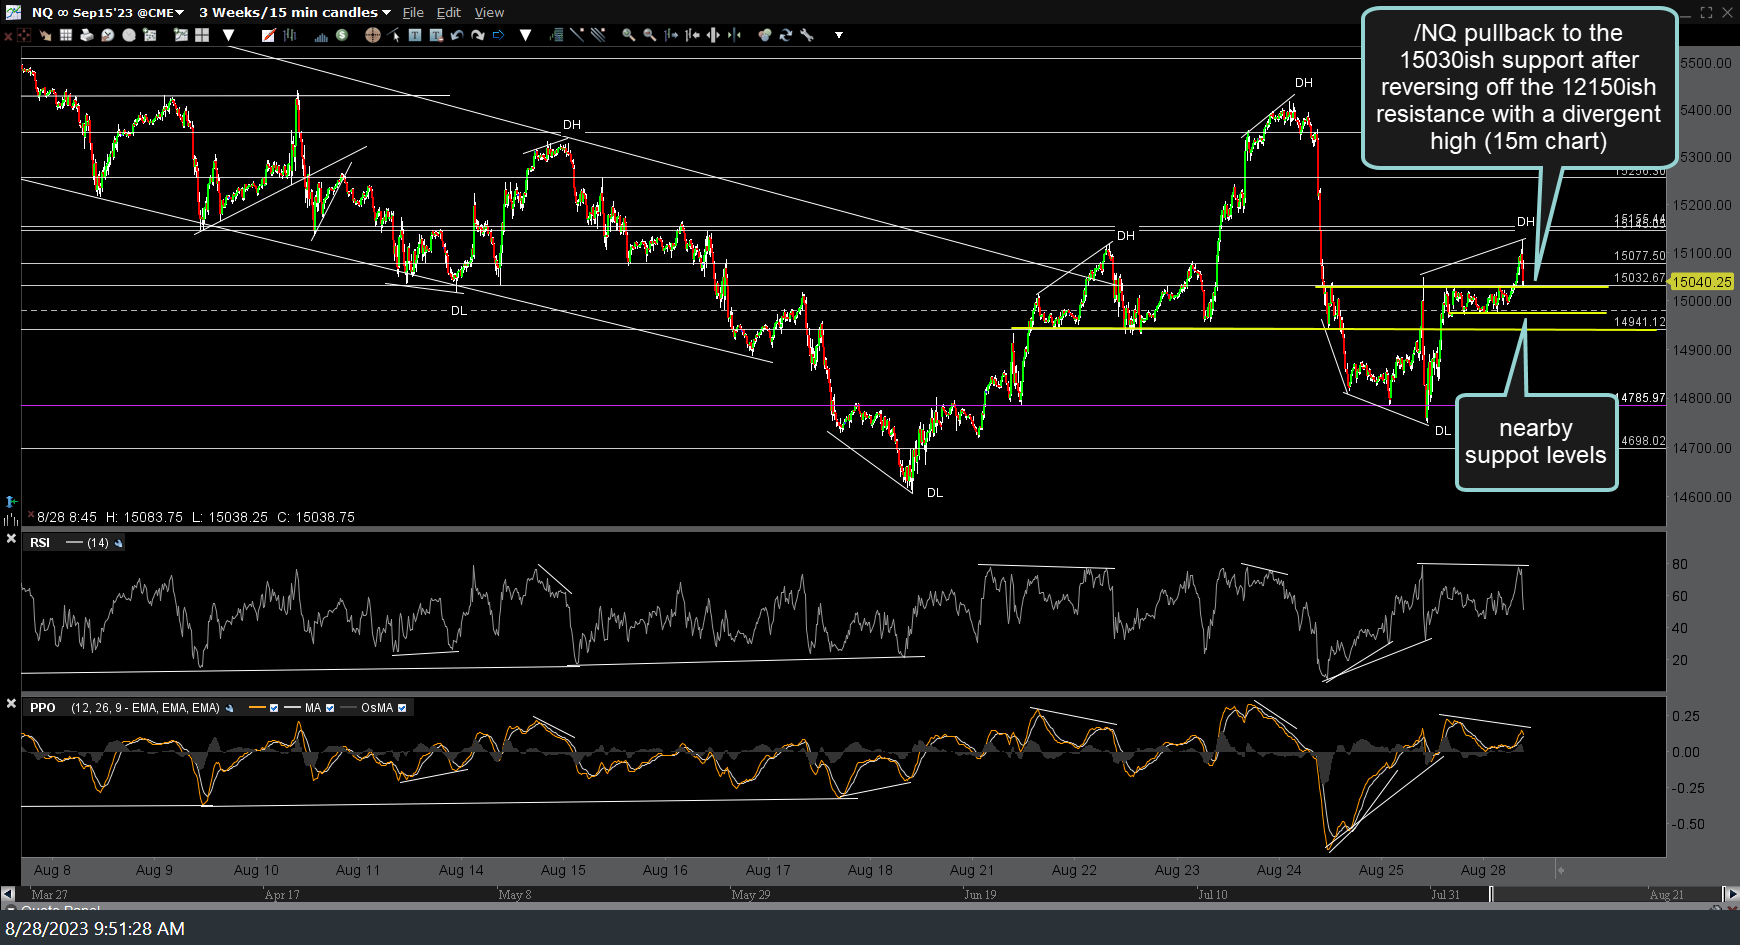
The large-caps are likely to make or break any significant chance of a rally for the small-caps. /NQ (Nasdaq 100 futures) has just pulled back to the 15030ish support after reversing off the 15150ish resistance shortly after the opening bell today with a divergent high on this 15m chart. (see the inflection points at the previous divergent highs & lows). As such, if /NQ can power through (negate or ‘take out’) these divergences and the 15150ish resistance above, the small-caps will likely follow suit & breakout above the falling wedge pattern. Likewise, solid break below any & especially all of the yellow support levels just below on this 15-minute chart of /NQ will likely spark another leg down in all of the stock indices.
Bigger picture & much more importantly, IMO, are those key uptrend & downtrend lines just above & below QQQ on the daily chart that we highlighted in Friday’s video. To a greater or lesser degree, I view anything that happens until QQQ makes a solid break above or below those key levels on the more significant daily time frame as “noise”, with an increased chance of whipsaws from breakouts/breakdowns on the intraday time frames.


