
/RTY (or IWM, TWM, TZA, etc..) sell signal to come on a solid break and/or 60-minute close below this bearish rising wedge pattern. Near-term pullback targets for a quick trade marked below the wedge (first 3 or 4 support levels) as well as my current max. pullback swing target of uptrend line & 1737 price support. As of now, this is an untriggered trade setup, pending an objective short entry via the aforementioned sell signal. 60-minute chart of /RTY below.
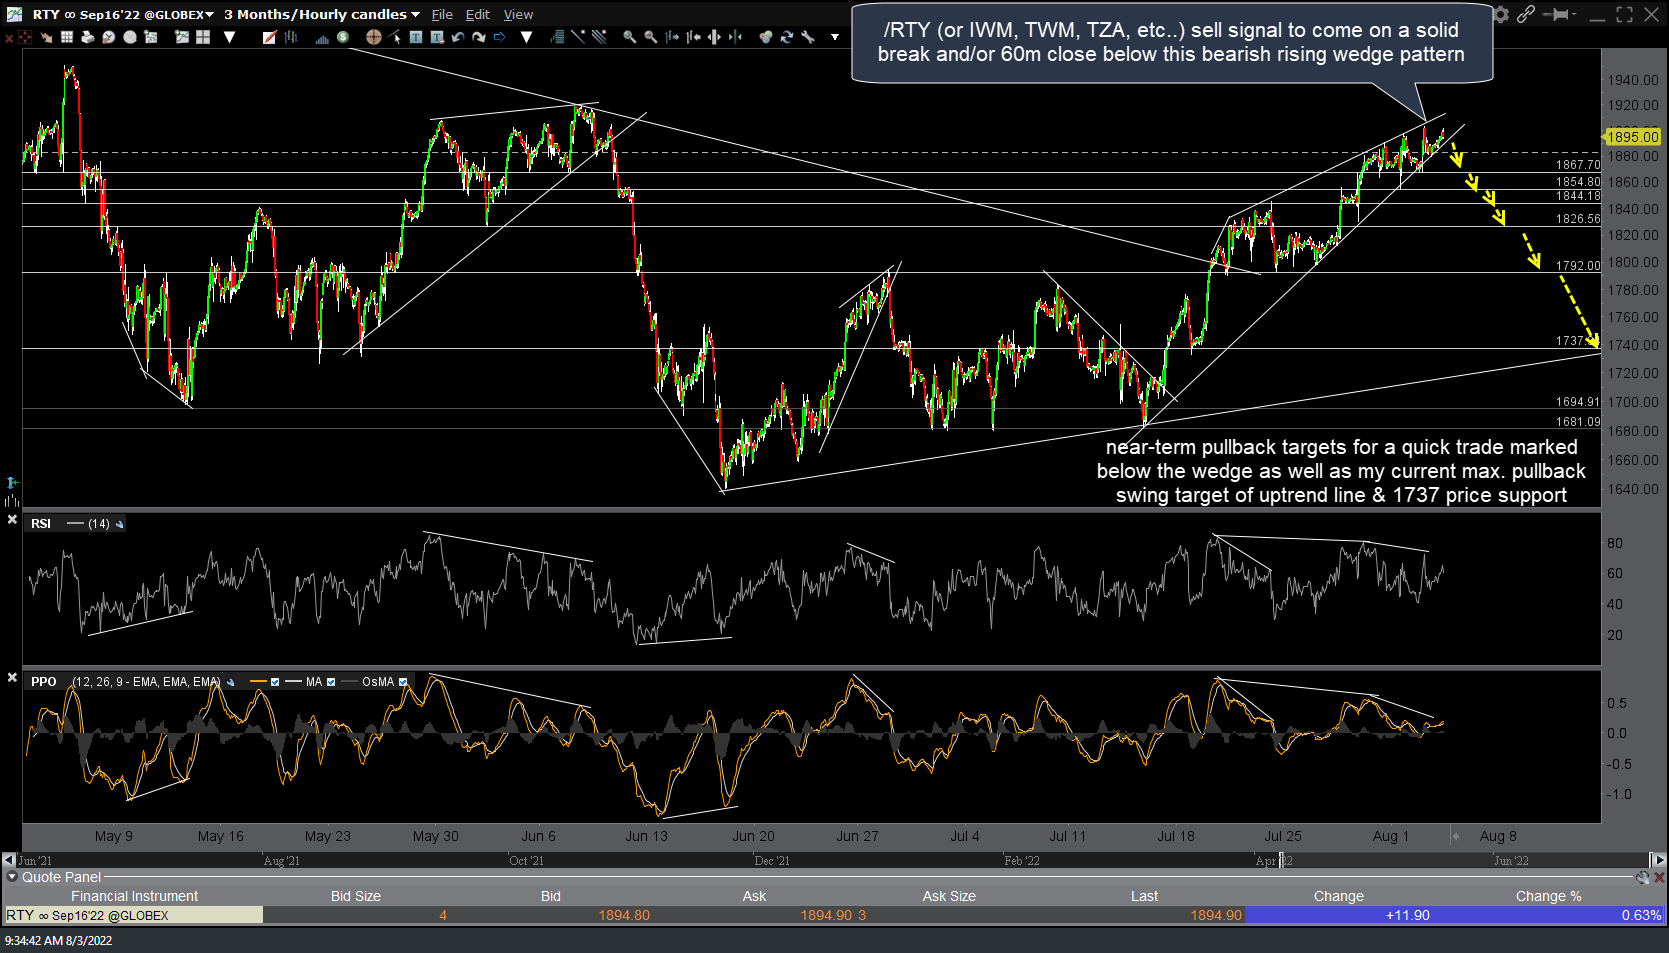
RTY 60m Aug 3rd
IWM (+1x ETF) or TWM (-2x ETF), TZA (-3x ETF), /RTY, etc..) short entry to come on a solid break and/or 60-minute close below this bearish rising wedge pattern with some swing targets on the IWM 60-minute chart below.

IWM 60m Aug 3rd
For those that take the trade & plan to use one of the inversed leveraged ETFs, simply align your preferred target(s) with the comparable levels on IWM via the reactions (highs/lows) of the candlesticks at the various pivots.