

/RTY (again) offers an objective short entry here at the 2190ish resistance/gap backfill & most recent divergent high as it once again gets rejected off this same level that was highlighted as an objective short entry on Tuesday (first chart below), except the negative divergence is even larger now plus SPY & QQQ have now taken out those near-term support levels I’ve been highlighting for the past few days. Previous (Tuesday) & updated 120-minute charts below.
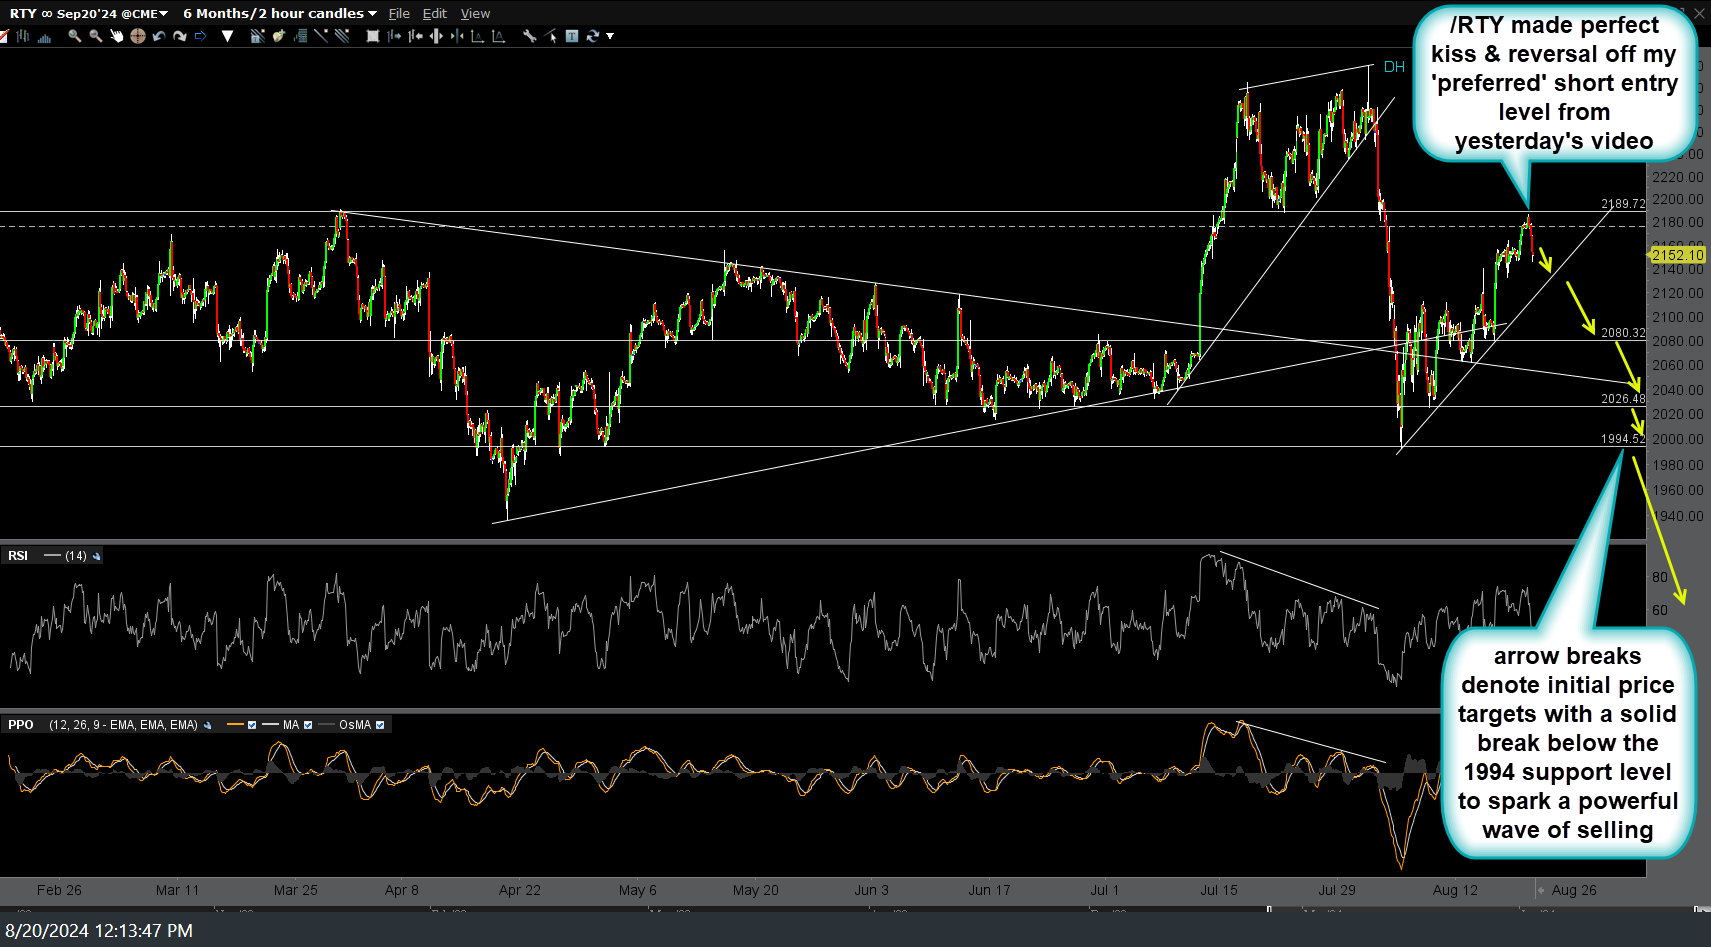
RTY 120m Aug 20th
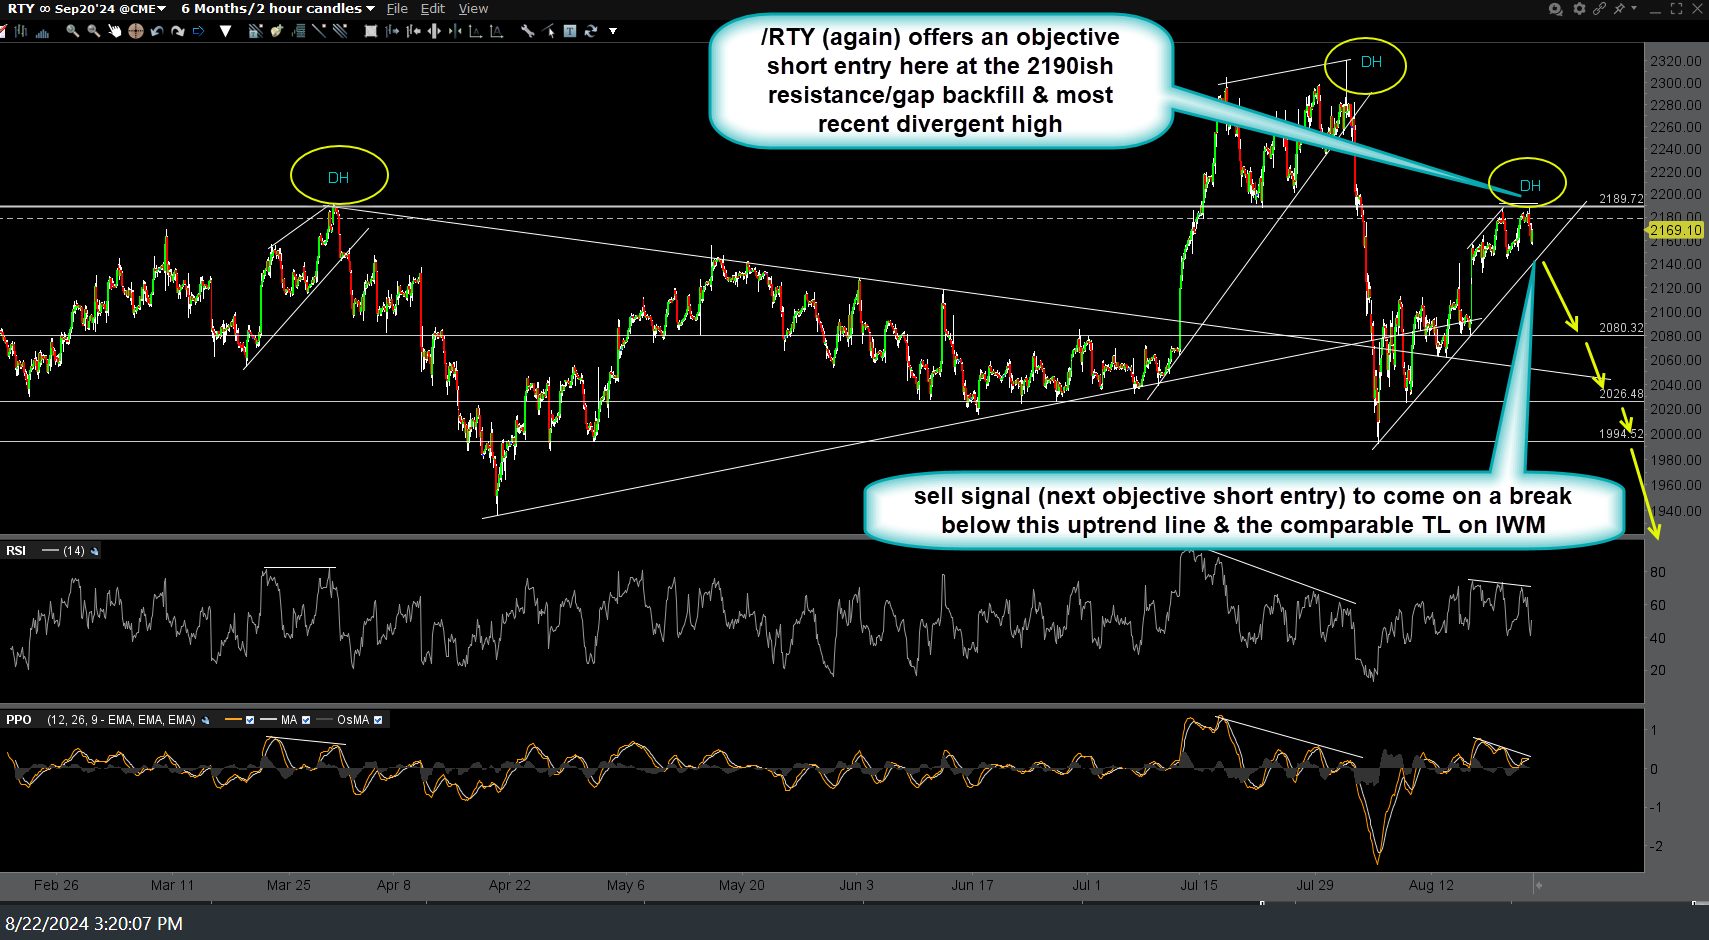
RTY 120m Aug 22nd
Likewise, IWM (Russell 2000 Small-cap Index ETF )once again offers an objective short entry here at the 215ish resistance/gap backfill & most recent divergent high. Previous (Tuesday’s) & updated 60-minute charts below.

IWM 60m Aug 20th
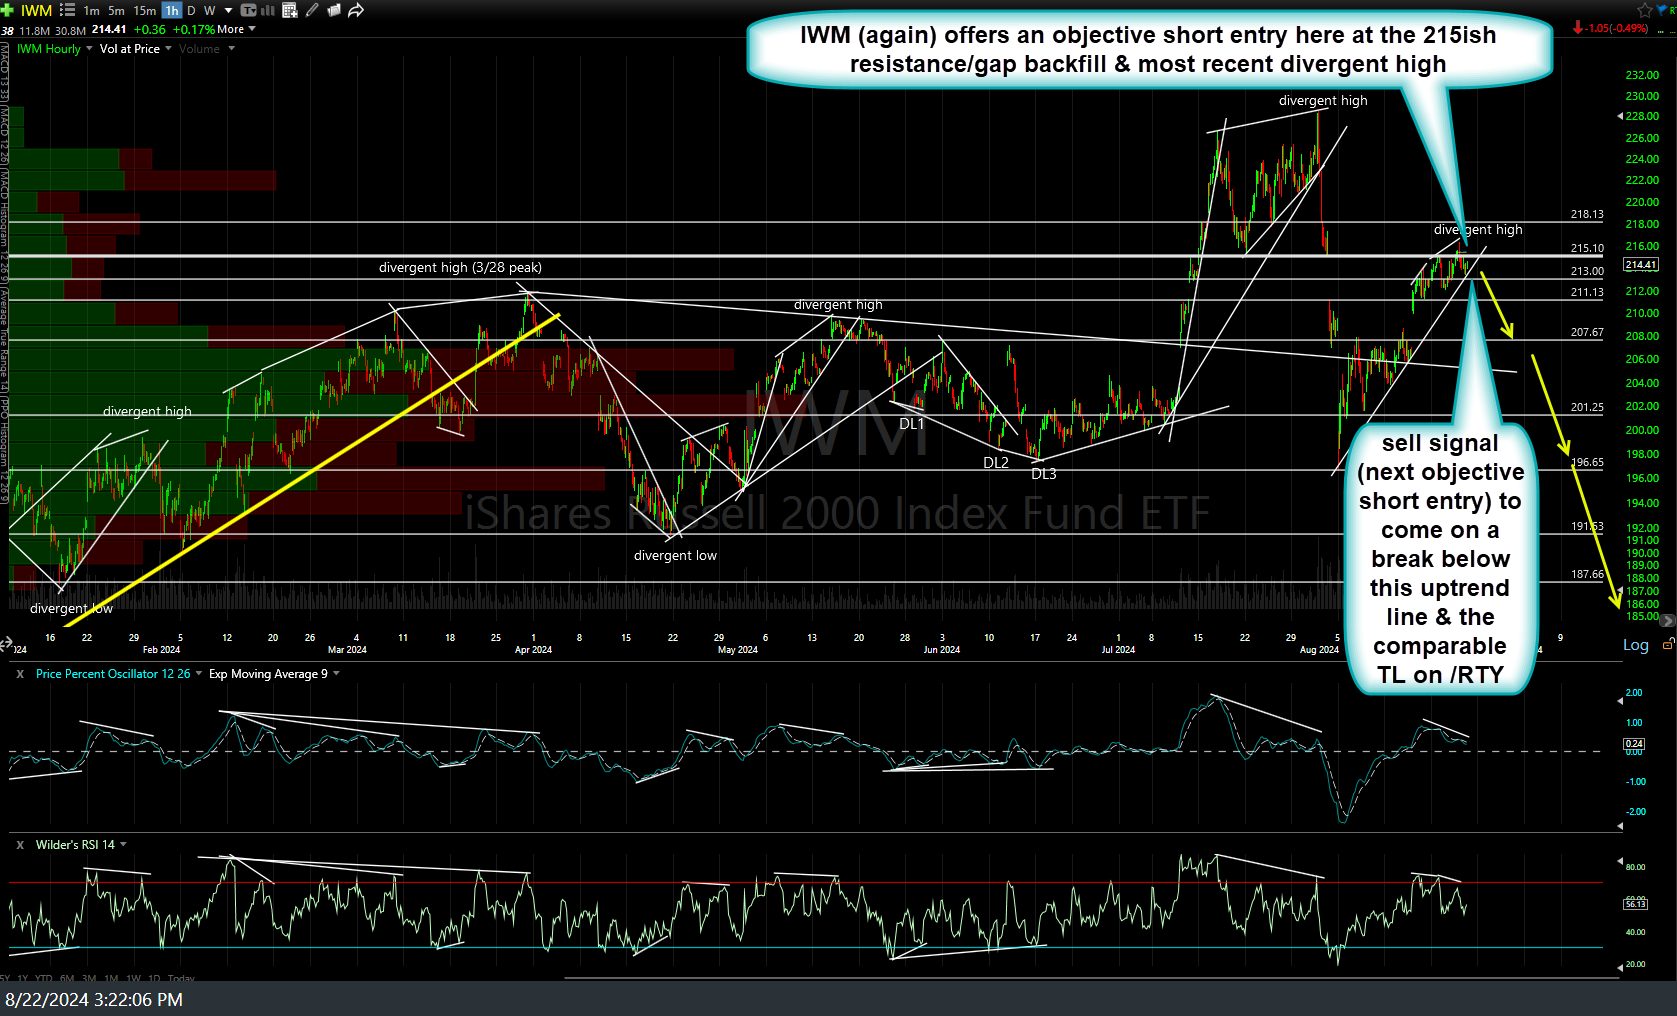
IWM 60m Aug 22nd
As shown on the charts above, while this is an objective short entry (shorting a bounce back into resistance), the next sell signal (and objective short entry) will come on a break below both of the comparable uptrend line on those /RTY & IWM charts above. My longer-term swing/trend target as per the previously posted weekly chart (T4) remains the first of the primary uptrend line & intersecting 144.20 support, about 33% below current levels.
As such, longer-term swing & trend traders eyeing that target might opt for a wider stop inline with that potential 33% drop (e.g.- 11% above current levels would provide a 3:1 R/R) while active traders just looking for a quick pullback to any of the near-term targets on the intraday charts above might consider a much lower stop commensurate with one’s preferred target(s) or even a very tight stop somewhat above these resistance levels that /RTY & IWM have been testing this week.