
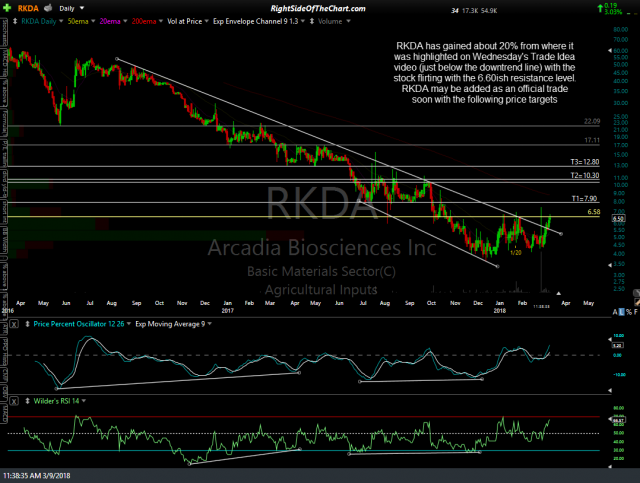
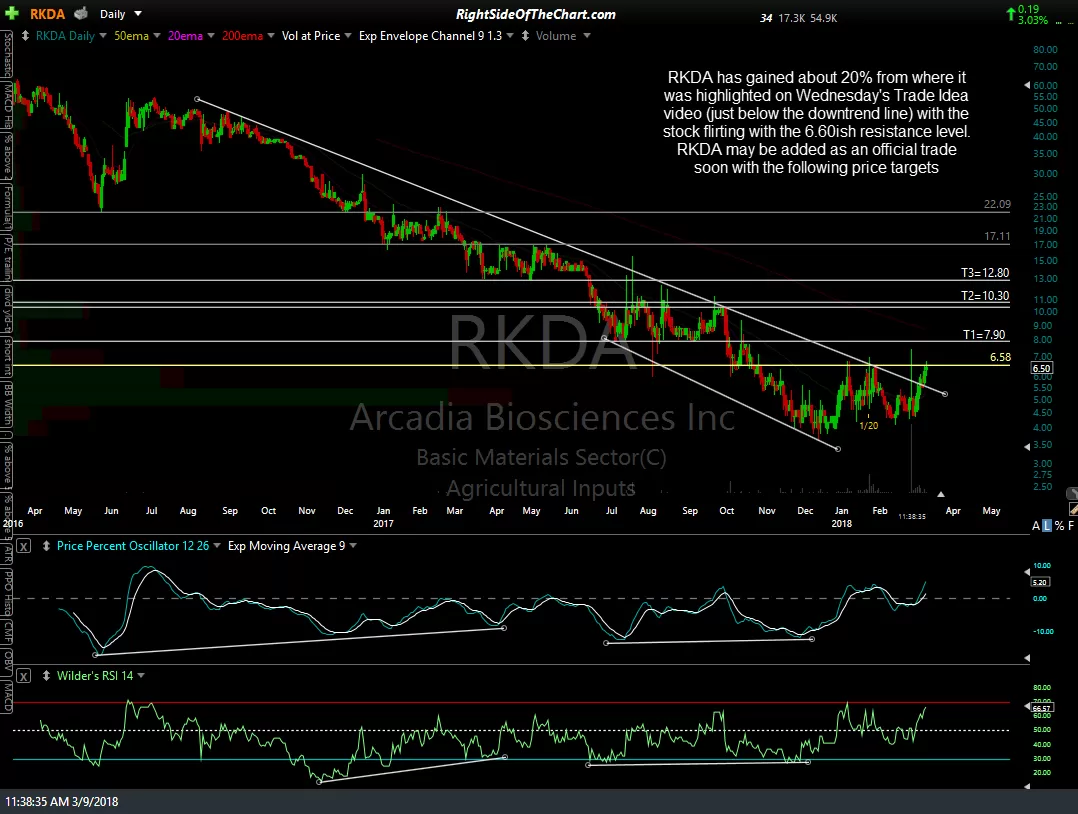
The RKDA (Arcadia Biosciences Inc) trade idea that was posted recently in the trading room as well as covered in Wednesday’s Swing Trade Ideas video along with another follow-up post earlier today while testing the 6.58 resistance level, has exploded following the breakout above that key resistance level which came on the heels of yesterday’s breakout & close above the primary downtrend line. One had to either be already positioned long or have been quick to enter or add-on to an existing position taken on yesterday’s trendline breakout following today’s break above 6.58 as RKDA exploded & never looked back, blowing right past T1 & T2 (where I expect prices to settle back to & probably close their today) with the stock up 83% on the day & over 100% from yesterday’s trendline breakout. Congrats to those that caught it.
click on first chart to expand, then click anywhere on the right of each chart to advance to the next expanded chart image
-
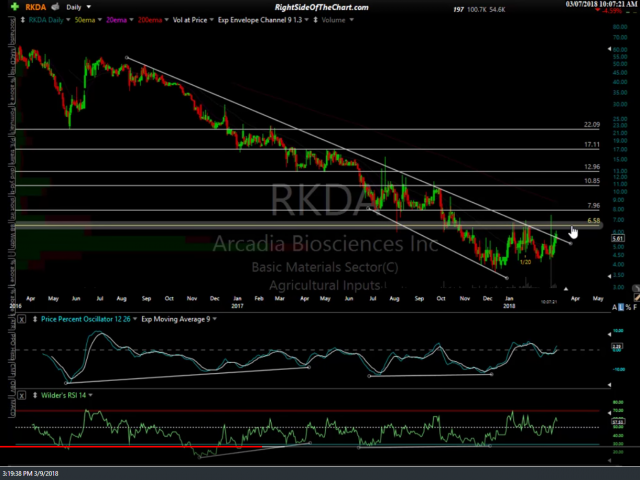
- RKDA video screenshot March 9th
-
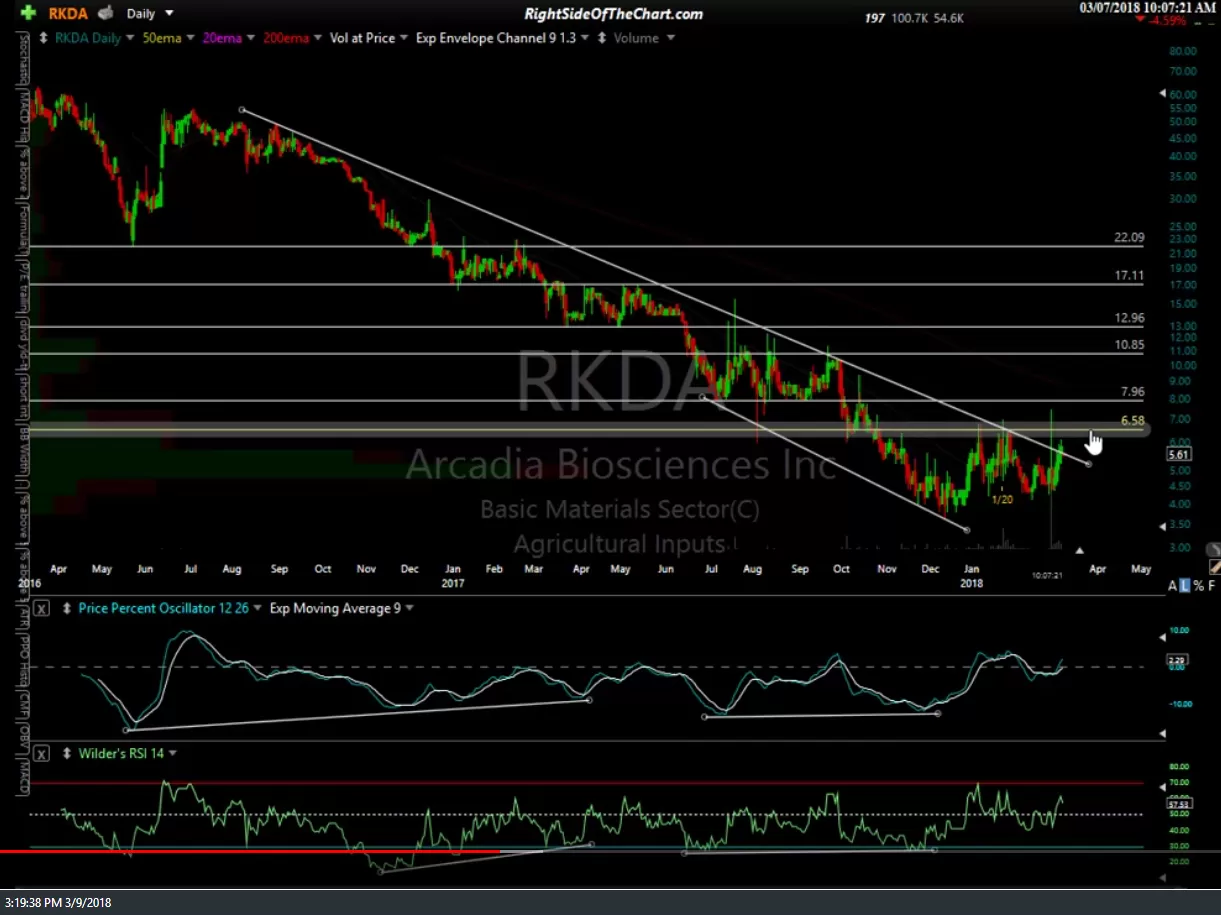
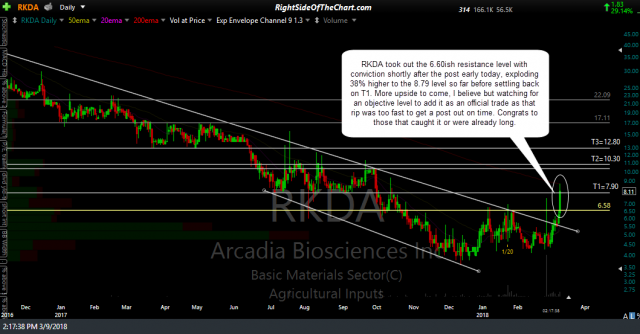
- RKDA daily March 9th
-
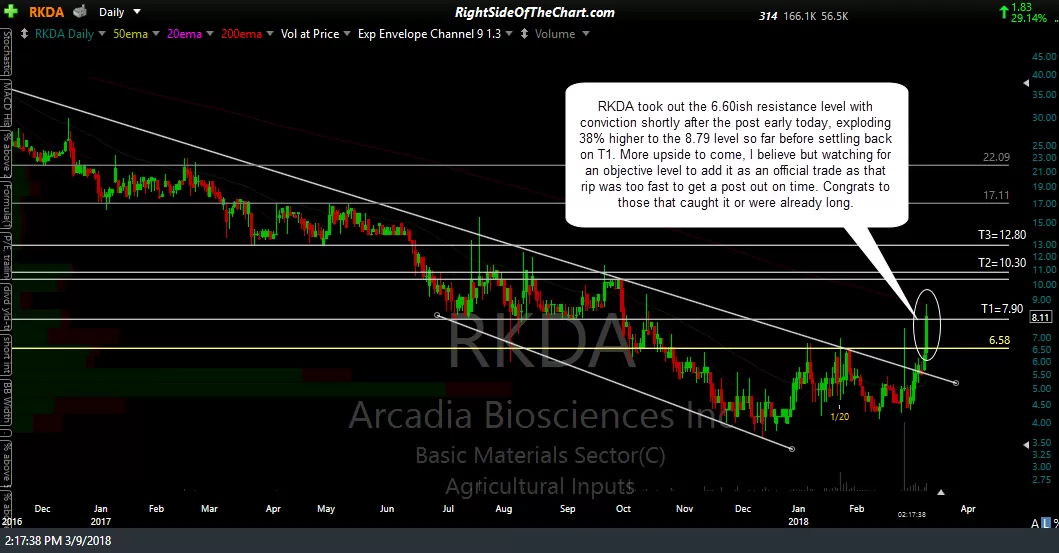
- RKDA daily 2 March 9th
-

- RKDA daily 3 March 9th
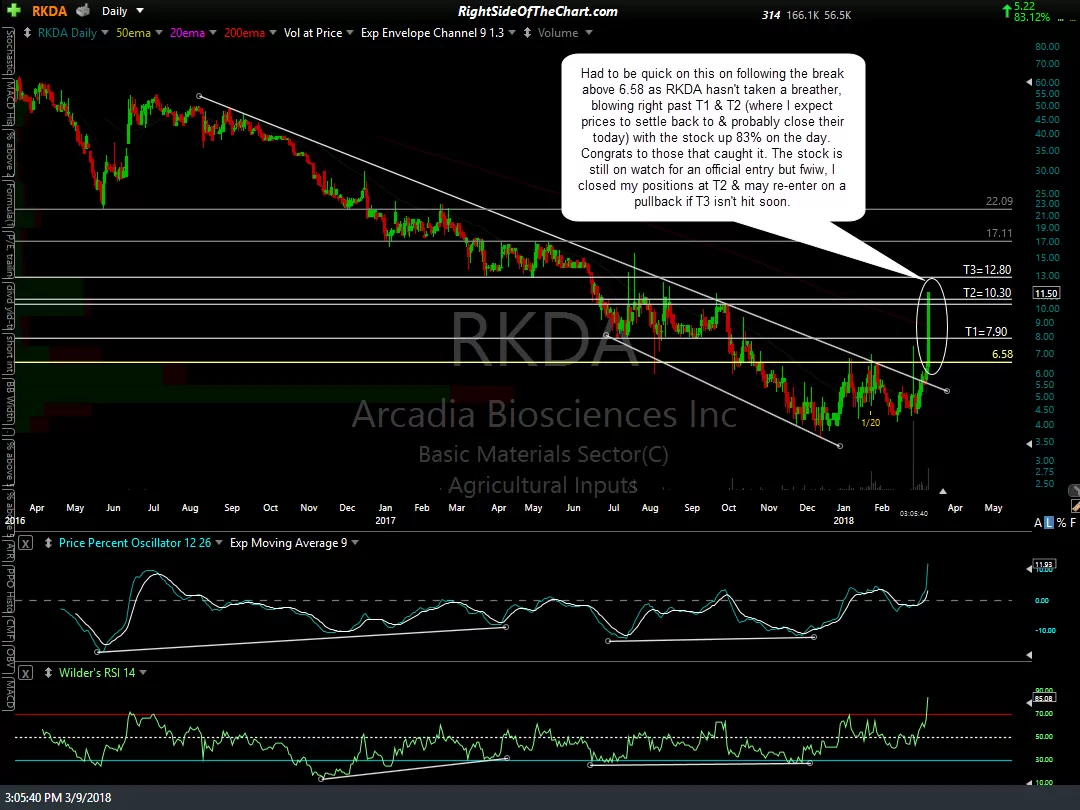
The stock is still on watch for an official entry but fwiw, I closed my positions at T2 & may re-enter on a pullback if T3 isn’t hit soon. The daily charts above are the screenshot from Wednesday’s video followed by the two charts posted in the update on Arcadia Biosciences earlier today along with updated chart showing prices clearing the resistance zone in which T2 was set just below: