
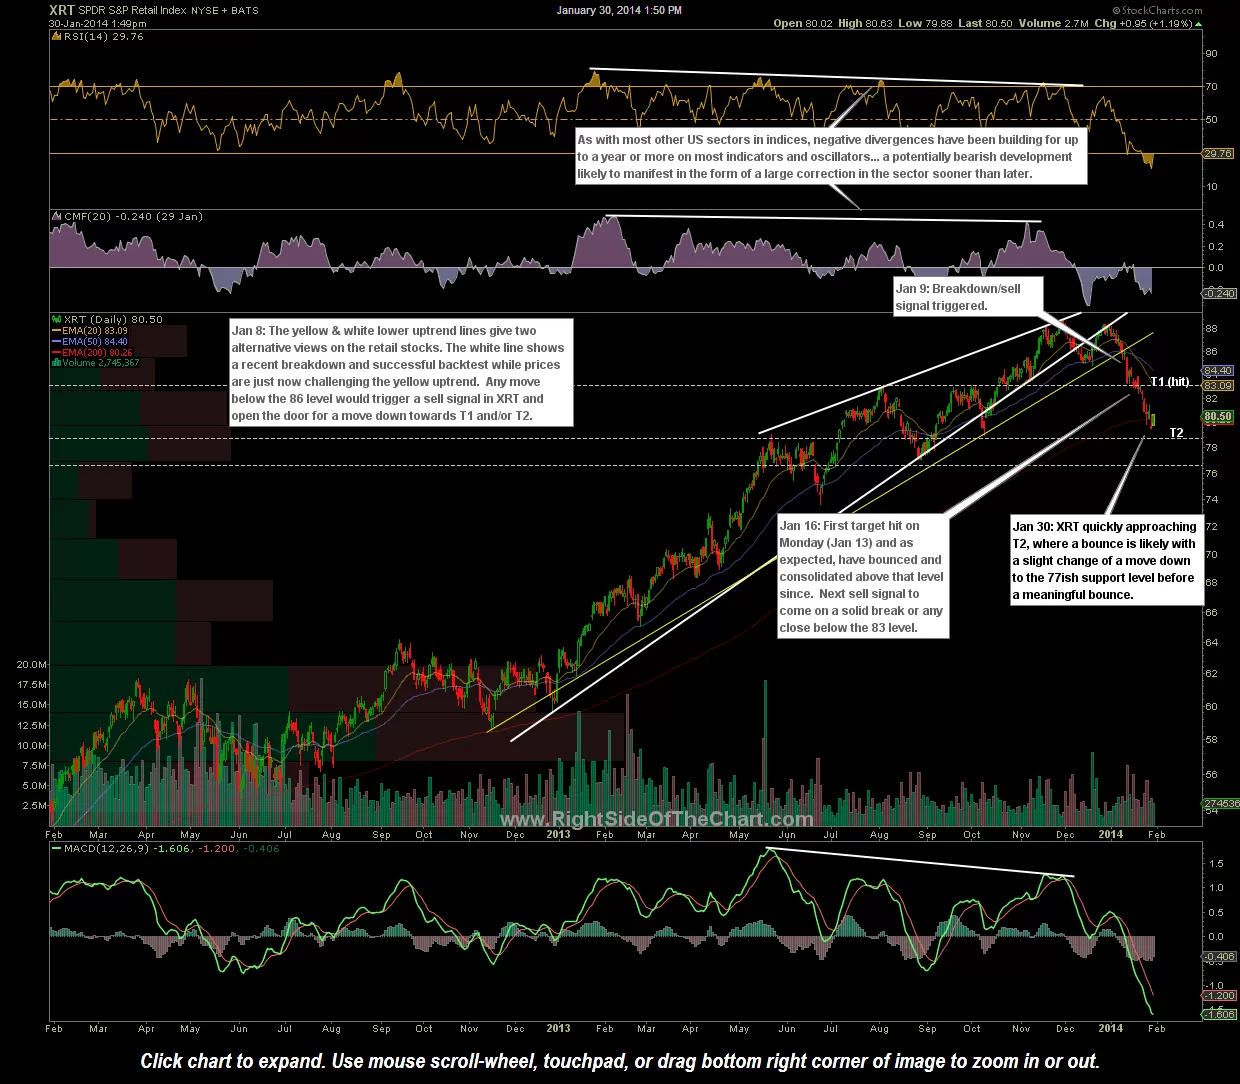
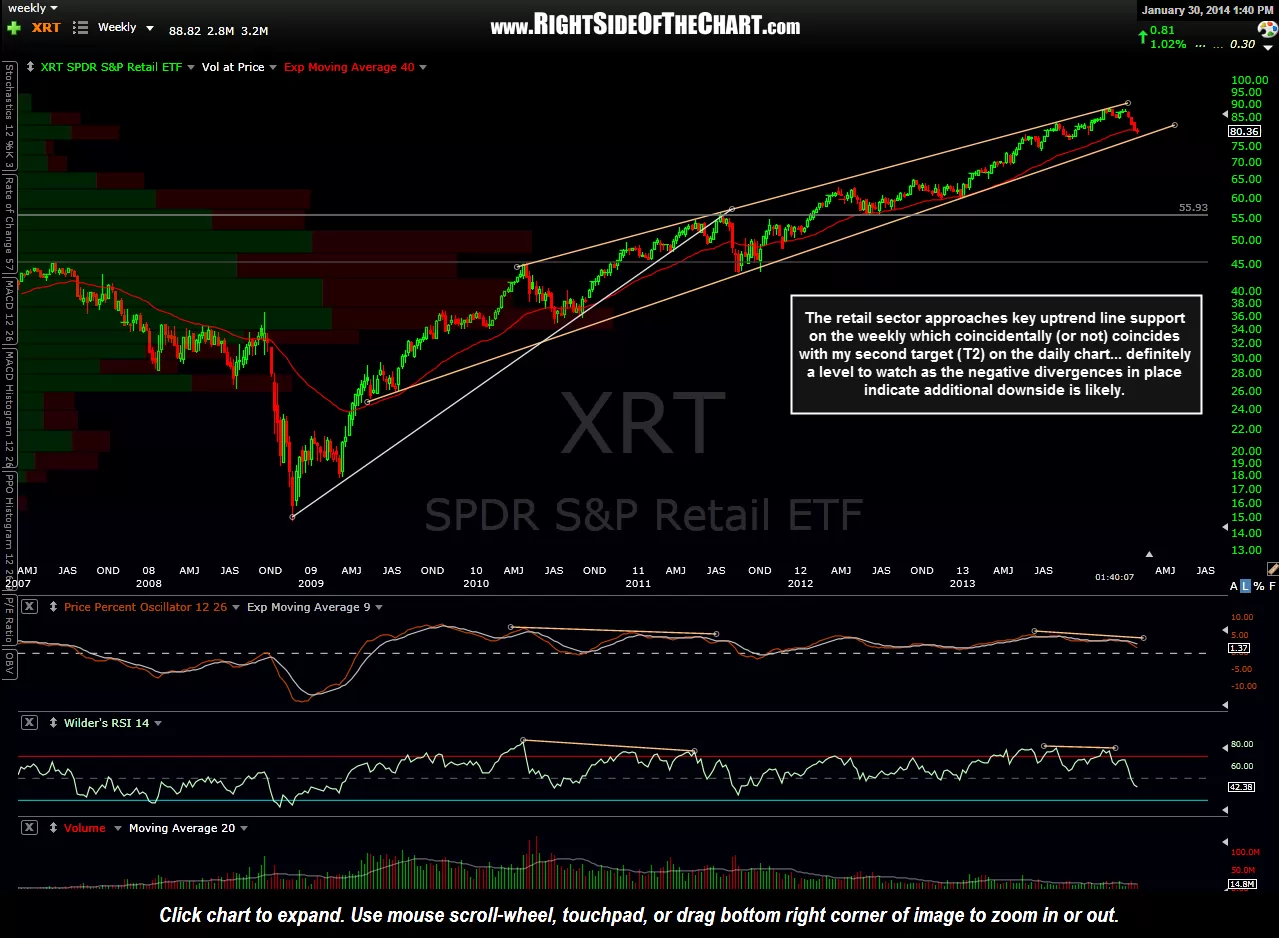
XRT, the retail sector ETF, is approaching key uptrend line support on the weekly chart which coincidentally (or not) happens to coincide with my second downside target (T2) on the daily chart. With multi-month negative divergences in place on both the weekly RSI and PPO, as well as prices cracking below the 40-week/200-day EMA, my expectation would be for a relative minor bounce off these support levels with a breakdown below the weekly uptrend line triggering a longer-term sell signal in the upcoming weeks/months. So far, XRT is has fallen 7% since the Jan 8th correction call (22 days or 15 trading sessions).
The image gallery below is a quick pictorial history of XRT since the Jan 8th post titled Correction In The Retail Stocks Likely. As consumer spending makes up for about 2/3rds of GDP in the United States, any technical confirmation (i.e.- weekly trendline break) could signal trouble ahead for the economy. Although retail sales are typically considered a coincident indicator, keep in mind that retail sales figures (as subject to revisions & data manipulation as they are) are quite dated by the time the most recent figures are reported each month. Additionally, the stock market typically leads the economy by 6 months or so. Therefore, one would expect to see the retail stocks begin a new downtrend well before the talking heads on TV realize that the the retail sales numbers are starting to tank. For reference, during the last recession, the XRT peaked in early June 2007 while the stock market (S&P 500) did not peak until mid October 2007, over 4 months later. The Retail Sales figures, with arrows highlighting the current MoM & YoY trends are shown in the last image in the gallery below. As always, click on the first image to expand to full size, then click anywhere on the right-hand side of the image to advance to the next chart. Each expanded chart can be further zoomed & panned once expanded. The live daily chart of XRT can be viewed by clicking here.
-

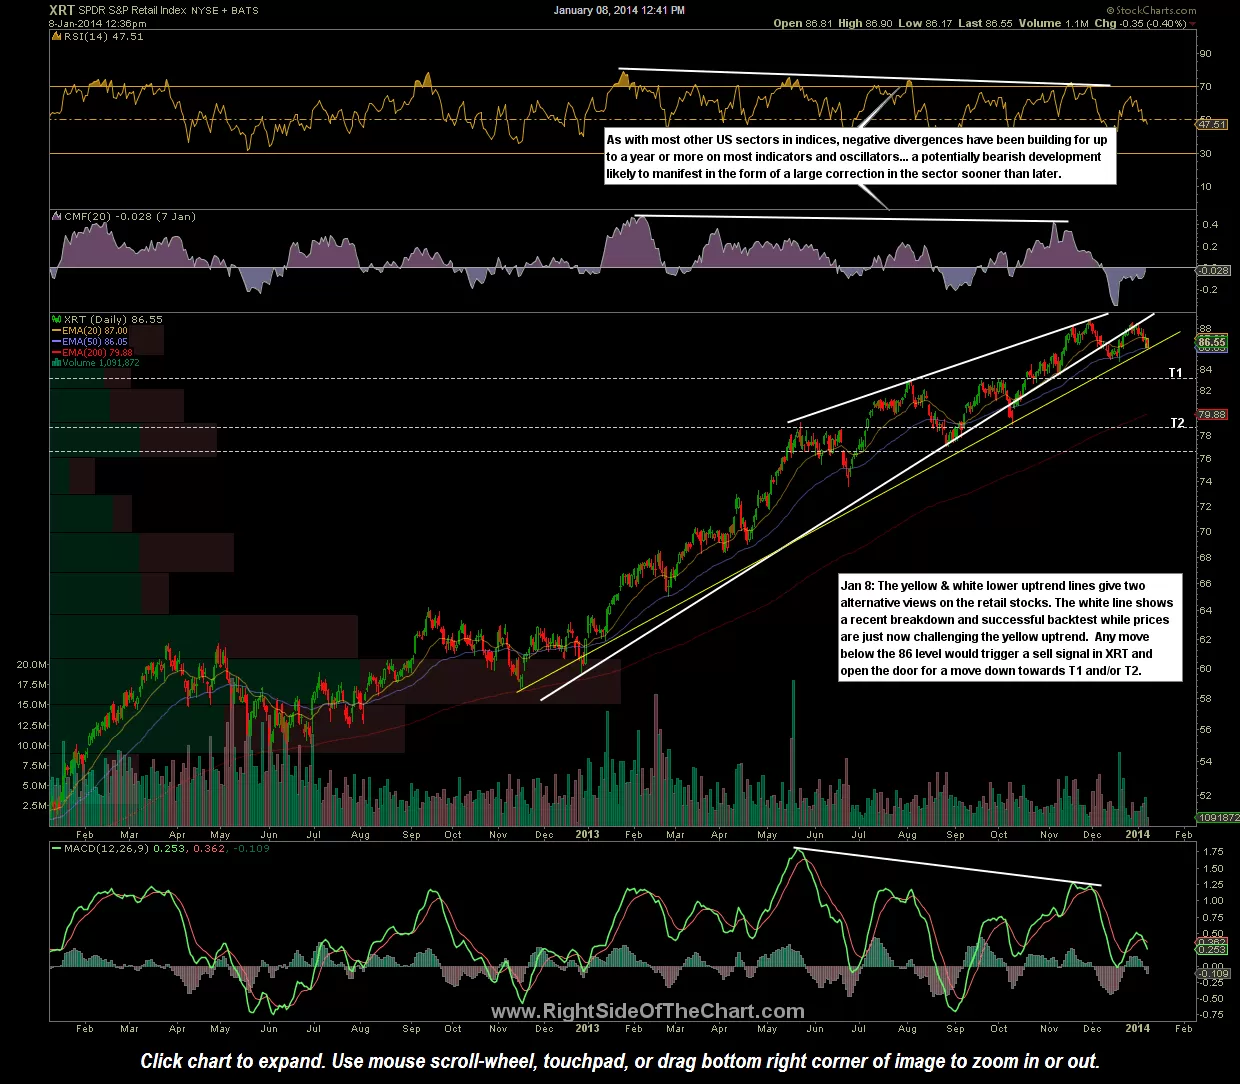
- XRT -Retail ETF Jan 8th
-

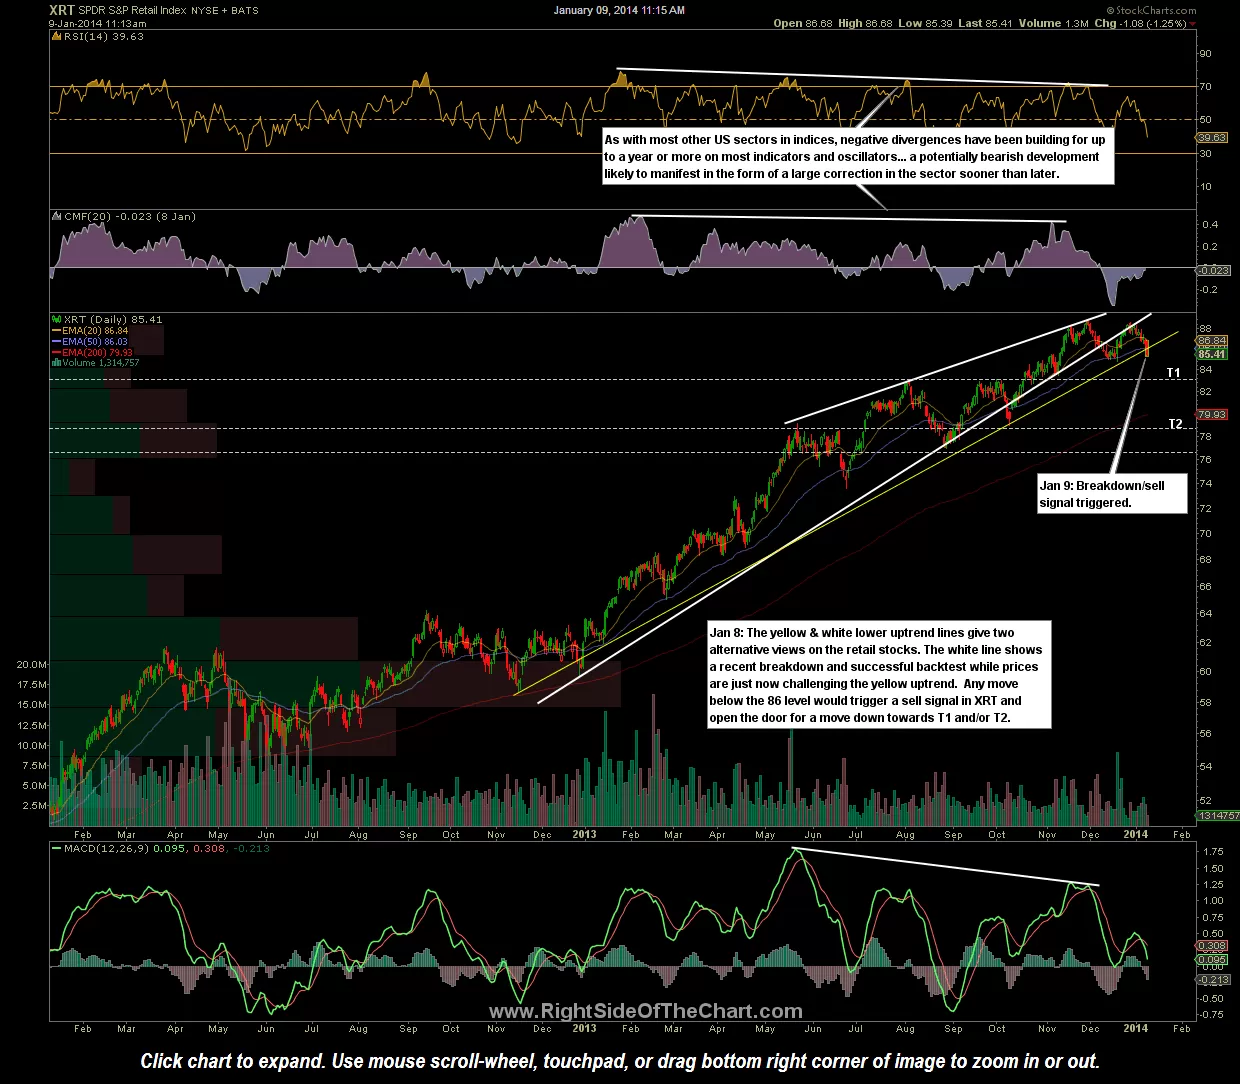
- XRT breakdown, Jan 9th
-
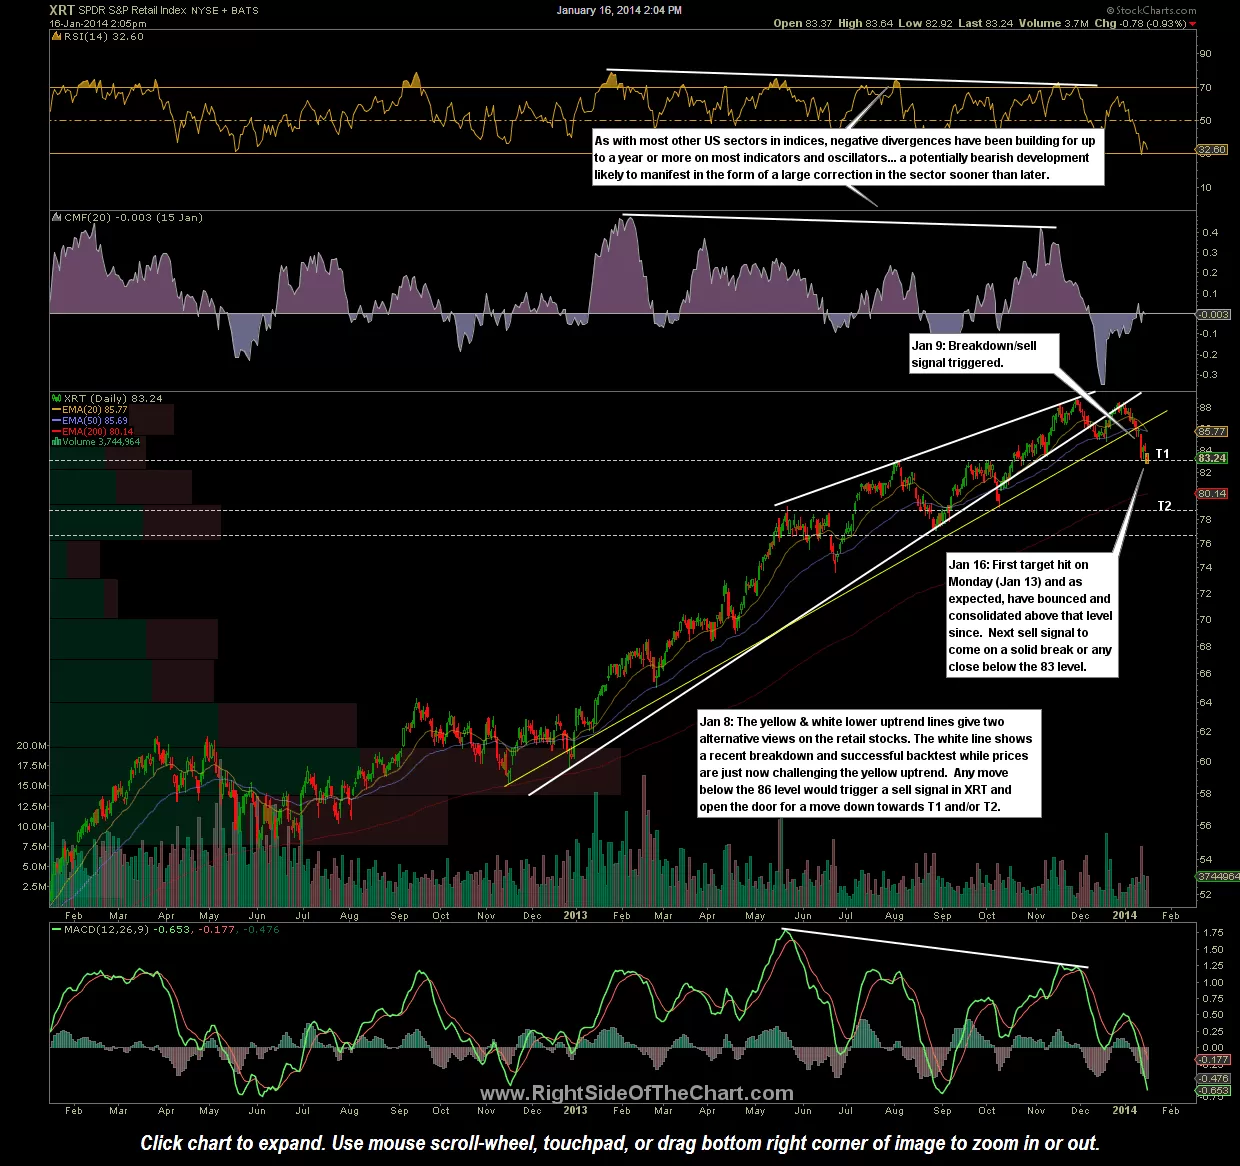
- XRT (retail ETF) Jan 16th
-

- XRT daily Jan 30th
-

- XRT weekly Jan 30th
-
- Retail Sales 1-14-14
