
I’ve wrapped up a video covering the outlook for the major auto manufactures along which should be posted shortly. In the beginng of the video, I highlighted the fact that we have a slew of potential market-moving economic data being released at 9:45 & 10:00 am ET, which would likely cause a swift rip & dip in the major indices. So far that has been the case with a sharp drop following the release of the PMI Manufacturing Index data at 9:45 (which came in slightly below expectations) with the ISM Manfacturing Index & Construction Spending released at 10:00 am with both of those also coming in below expectations (slightly below on ISM, fairly below on Construction Spending).
With those market moving reports now out of the way, along with the fast HFT rips & dips that often follow, we can now focus on where the market is likely headed today & throughout the week. The bigger picture & most significant technical recent development is the fact that while the S&P 500/SPY has recently broken & remains below its primary uptrend line, the Nasdaq 100/QQQ is still holding above its comparable uptrend line, albeit by a thread.
-
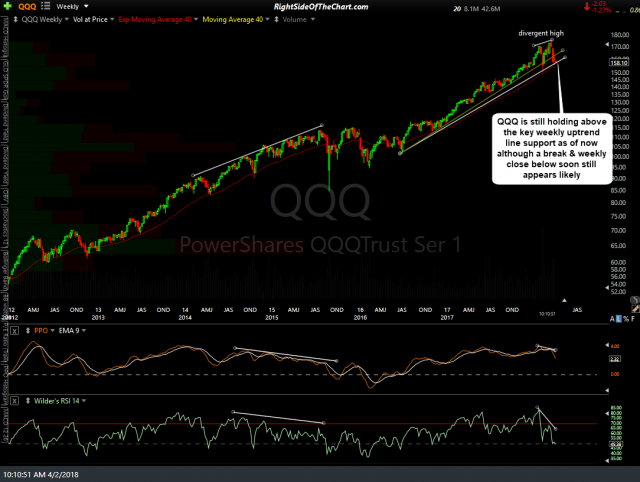
- QQQ weekly April 2nd

-
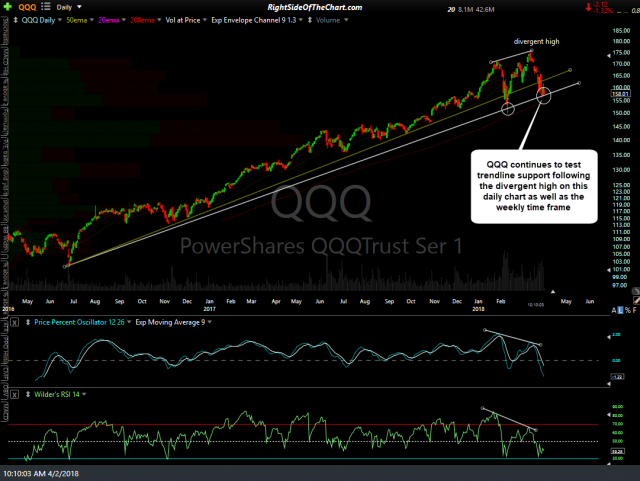
- QQQ daily April 2nd
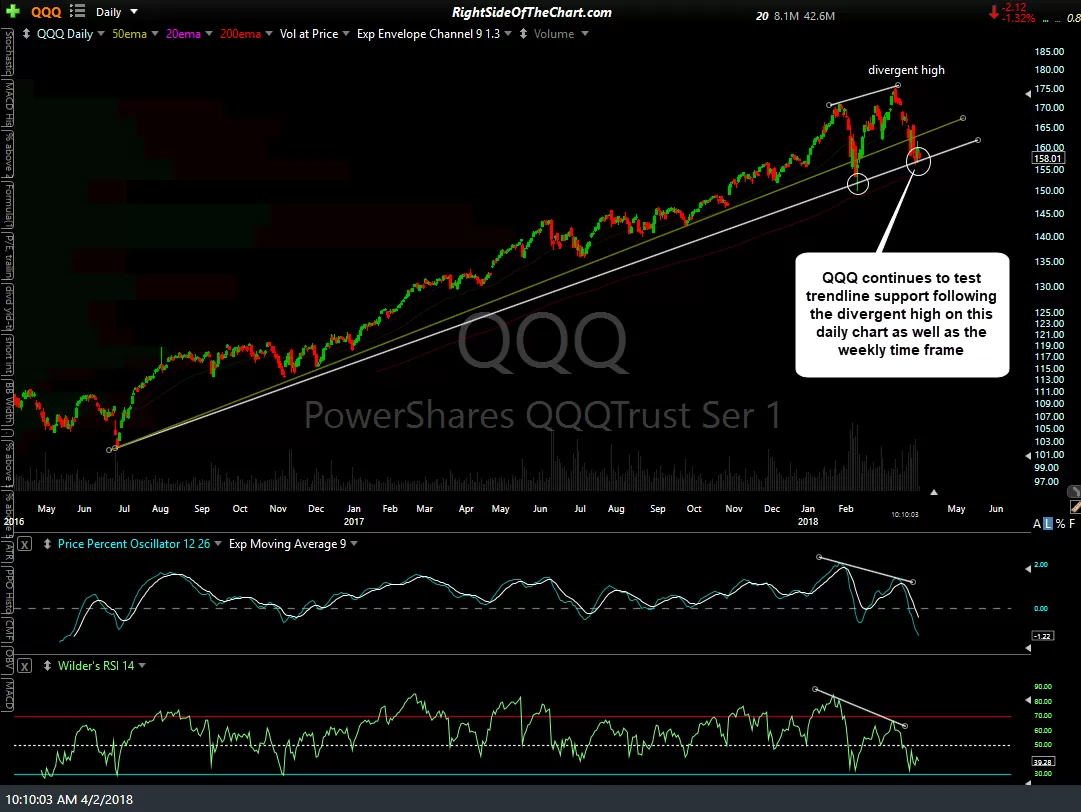
As I like to say, support is support until & unless broken and based on the fact that the mid-March high in QQQ was a divergent high on both the daily & weekly time frames, I still favor a break below the primary uptrend line on QQQ with more downside in the coming months. Whether that occurs this week or not is hard to say but I’ll be watching the support levels on this 60-minute chart below as a solid & impulsive break & close below the 155.79ish level, especially if the bullish divergences in place on the 60-minute chart are taken out, would take QQQ below that trendline & increase the odds that we print a weekly close (end of day Friday) below it. Doing so would increase the odds of more downside in the coming weeks & possibly months.
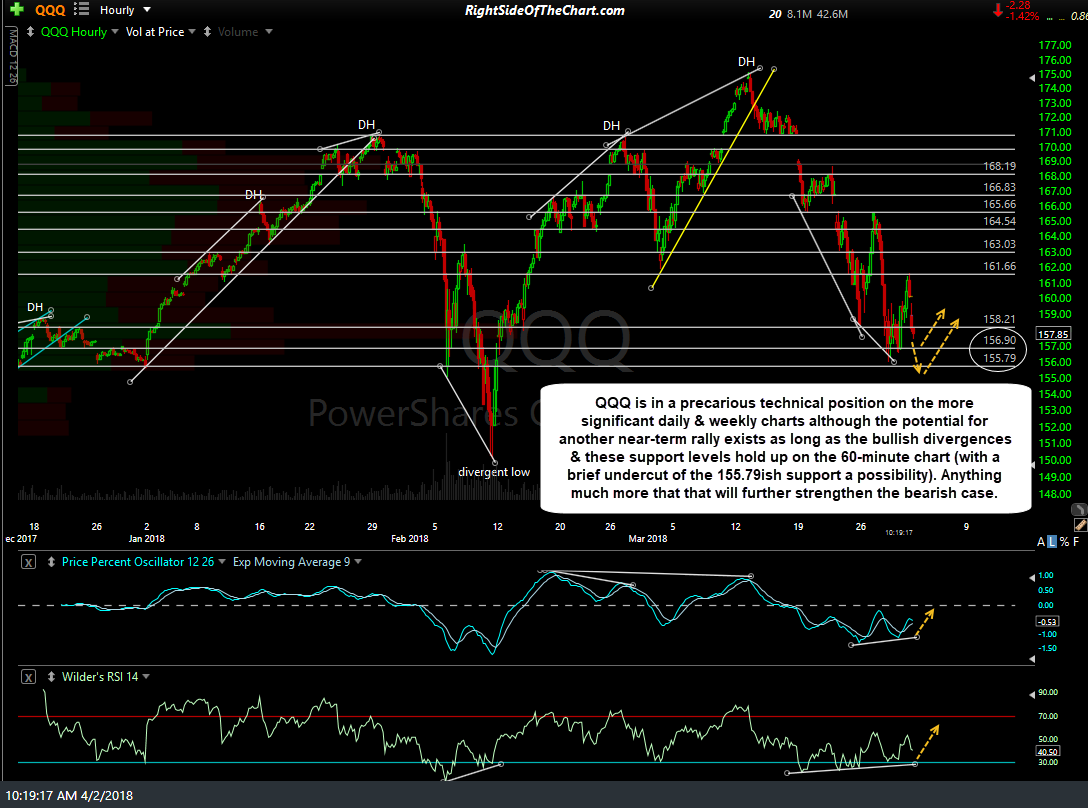
QQQ 60-min April 2nd
Bottom line: QQQ is in a precarious technical position on the more significant daily & weekly charts although the potential for another near-term rally exists as long as the bullish divergences & these support levels hold up on the 60-minute chart (with a brief undercut of the 155.79ish support a possibility). Anything much more that that will further strengthen the bearish case.