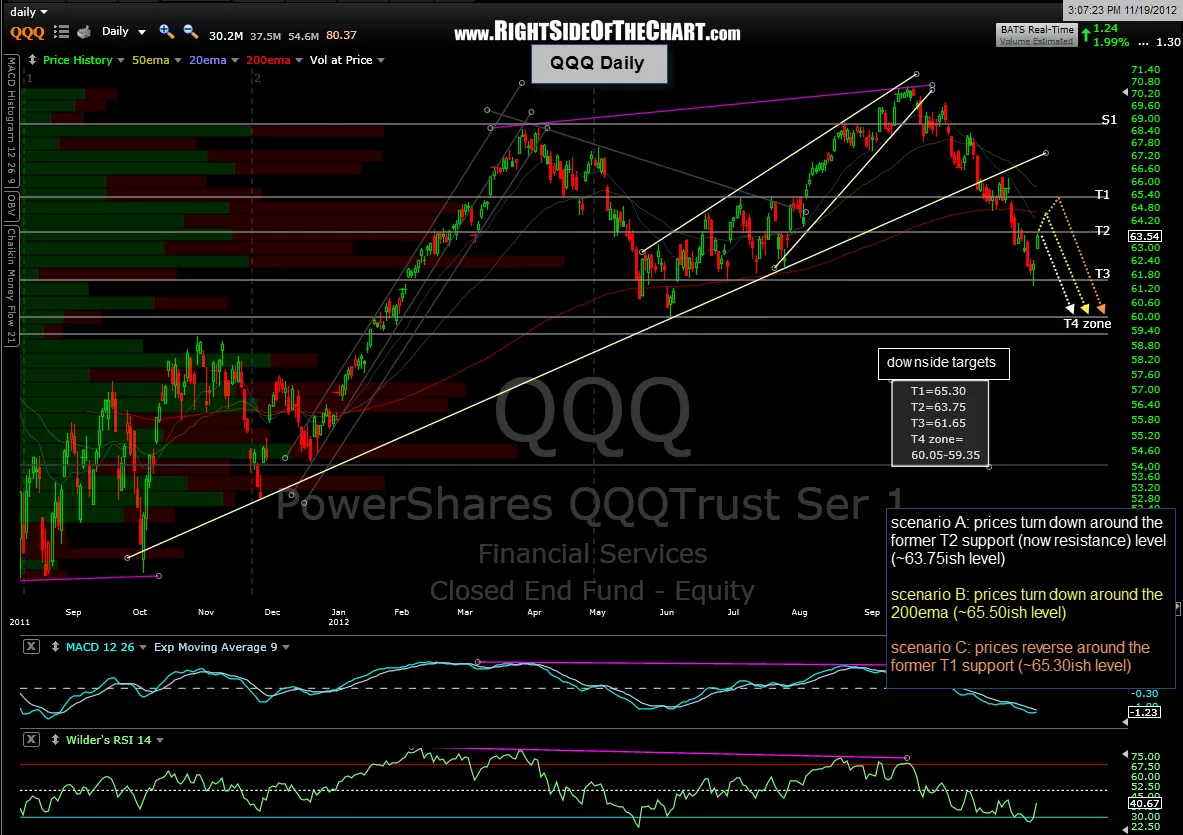
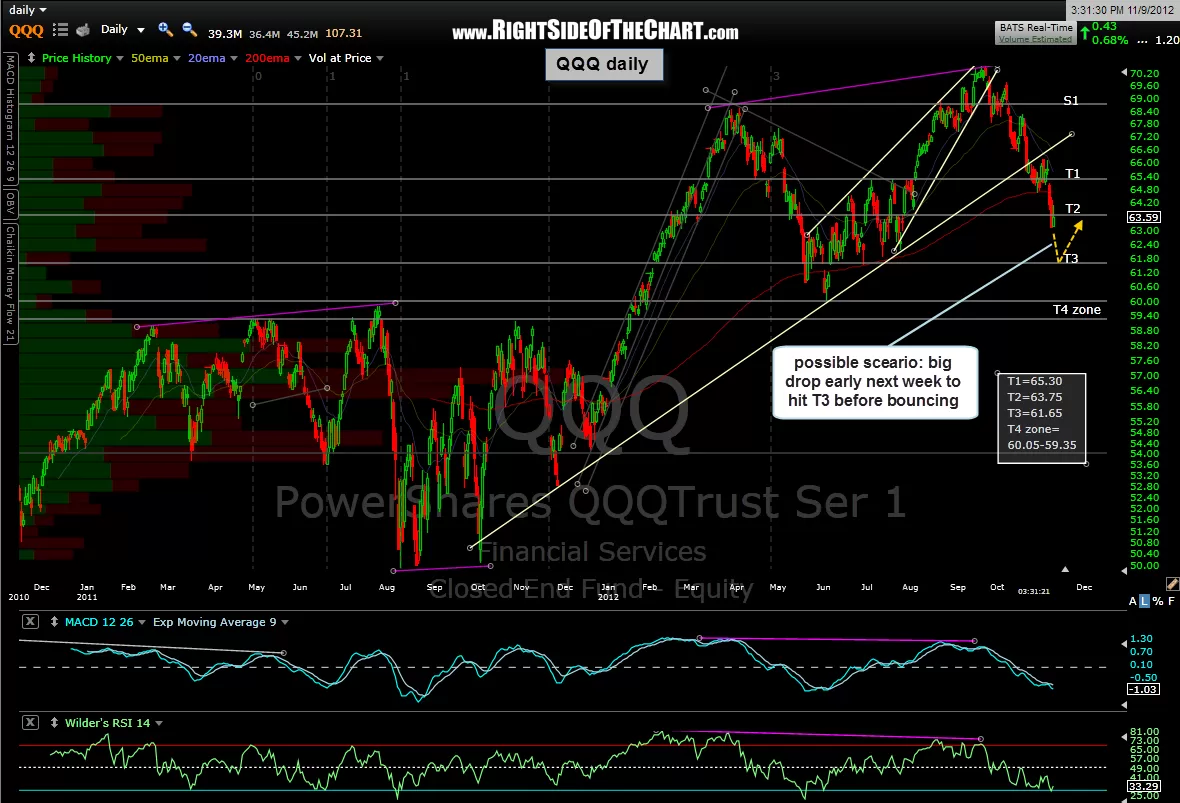
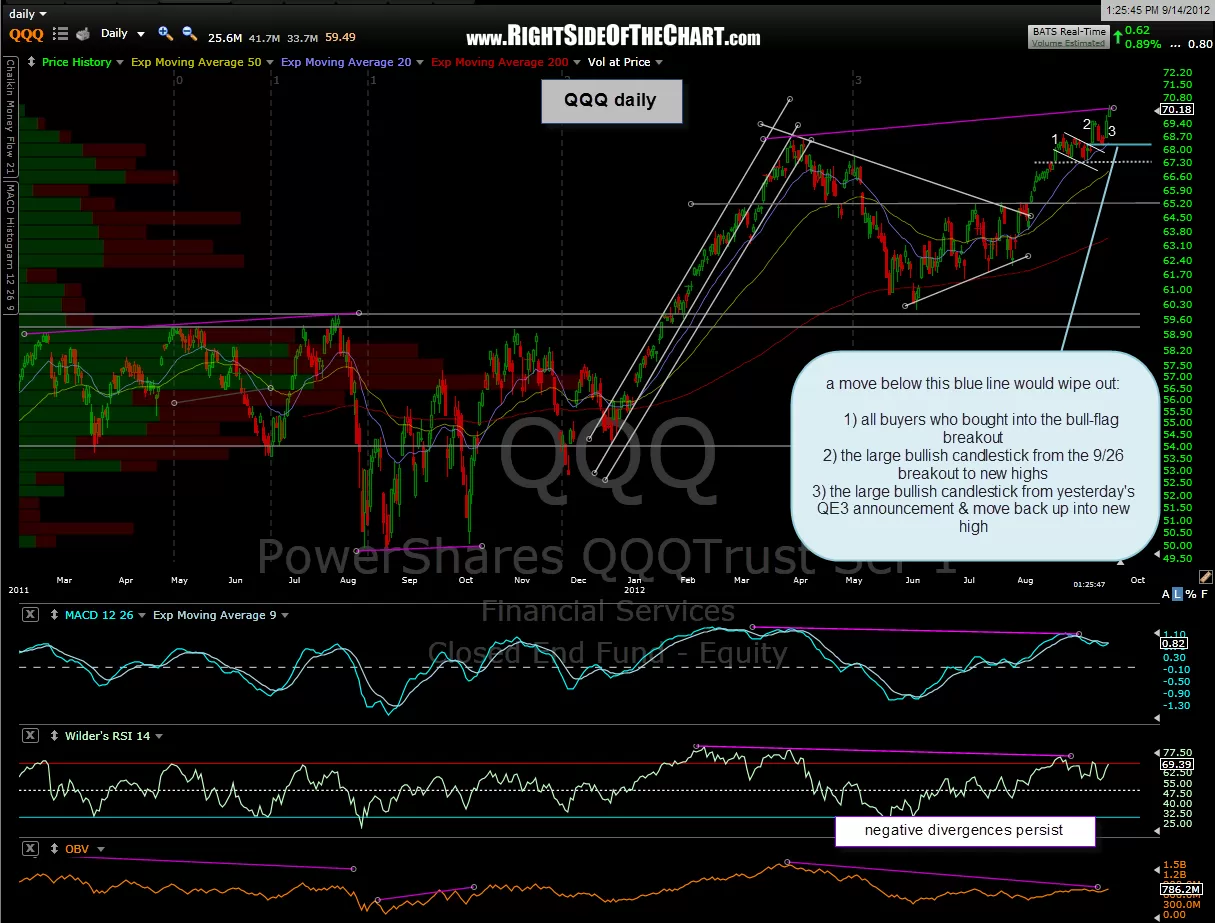
Here’s the updated QQQ daily chart showing what I believe to be the three most likely scenarios. Since today is the first full day of the bounce off T3 (the bounce started late Friday morning), it’s just too early for me to rank the scenarios in order of probability although the odds are skewed towards B or C (more upside from here before the bounce ends). Assuming that I’m correct and the market will go on to hit my final intermediate-term downside target, T4, before any meaningful and sustained rally, then I would say that this bounce, assuming that we go as high as the former T1 downside target (scenario C), could last anywhere from a few trading sessions to possibly as long as few weeks.
For those that might say “Yeah, but how do I trade three different scenarios at once?”, the answer is easy: You don’t. One should avoid trading if your degree of confidence in the next direction of the market is not high. In fact, over-trading is one of the biggest reasons that many rookie traders fail. That is exactly why I’m keeping it light this week as I’d like to watch the market action over the next few days and possibly even into next week before deciding when & how to re-engage the market. One of my primary goals on this site is to provide straightforward, streamlined and unambiguous analysis, which I believe I have done to the best of my abilities. Although I have three differing scenarios at this point, they are all basically slight variations of the same scenario: any move higher from current levels is most likely a corrective counter-bounce within a larger downtrend that has not yet completed and could resume at anytime.
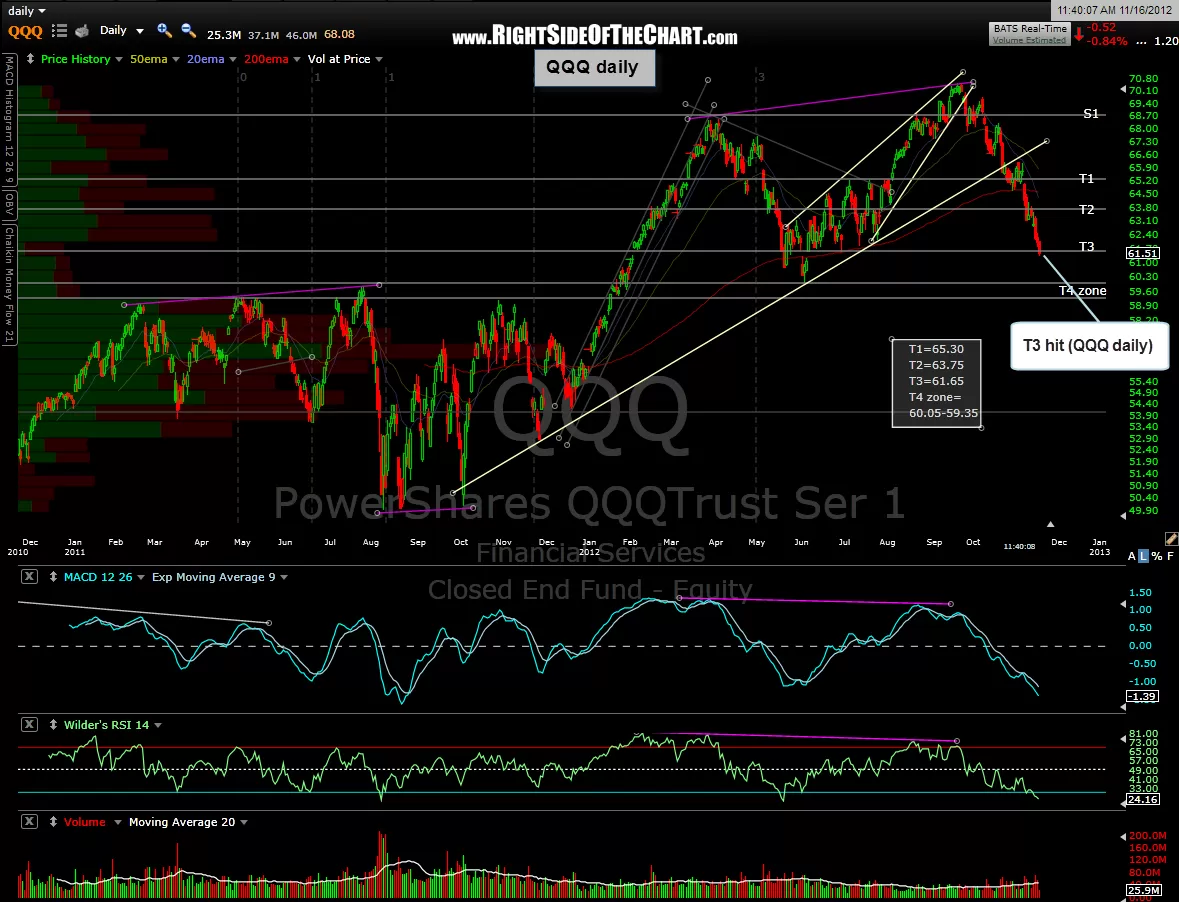
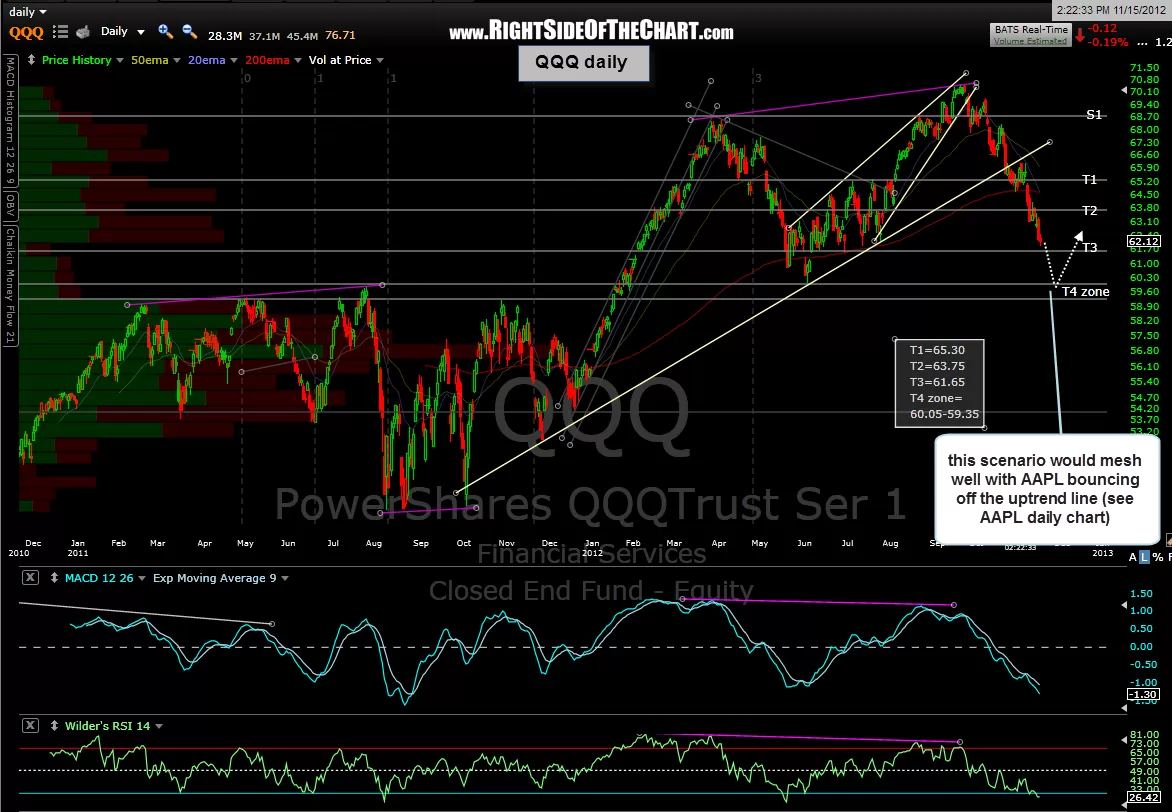
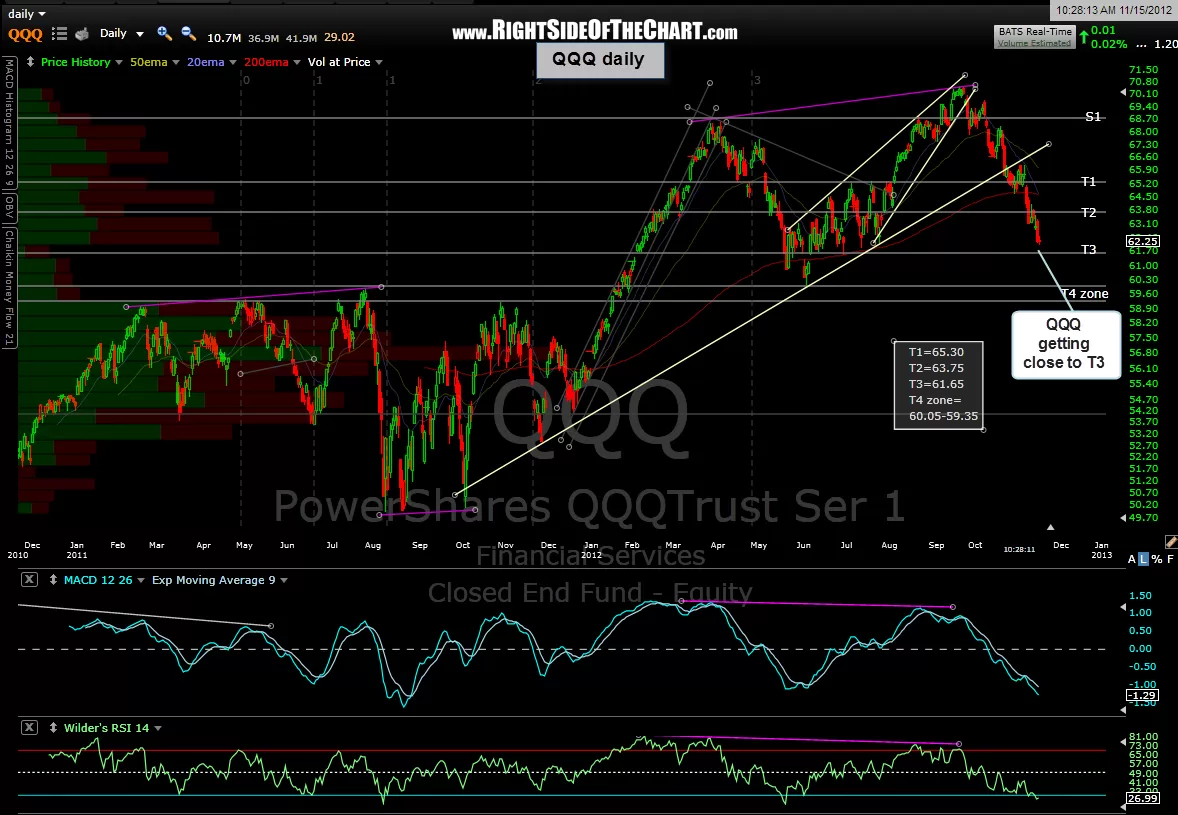
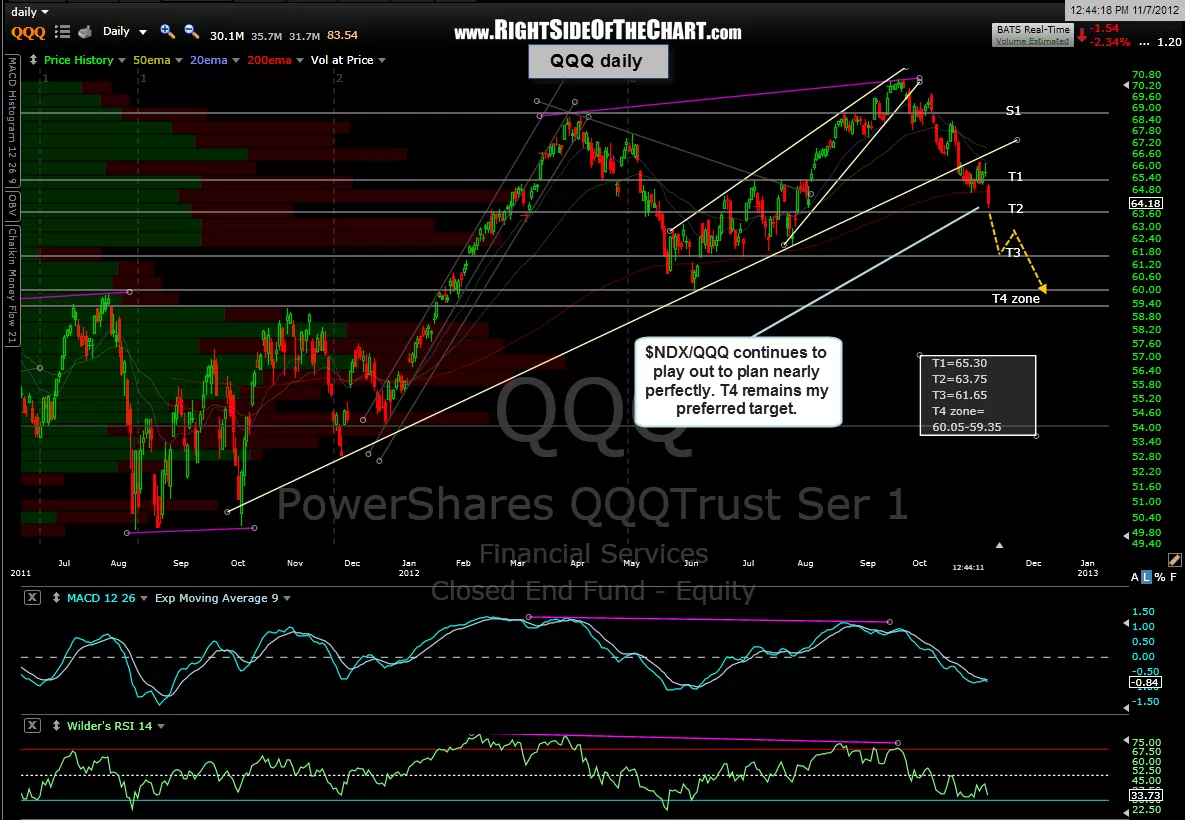
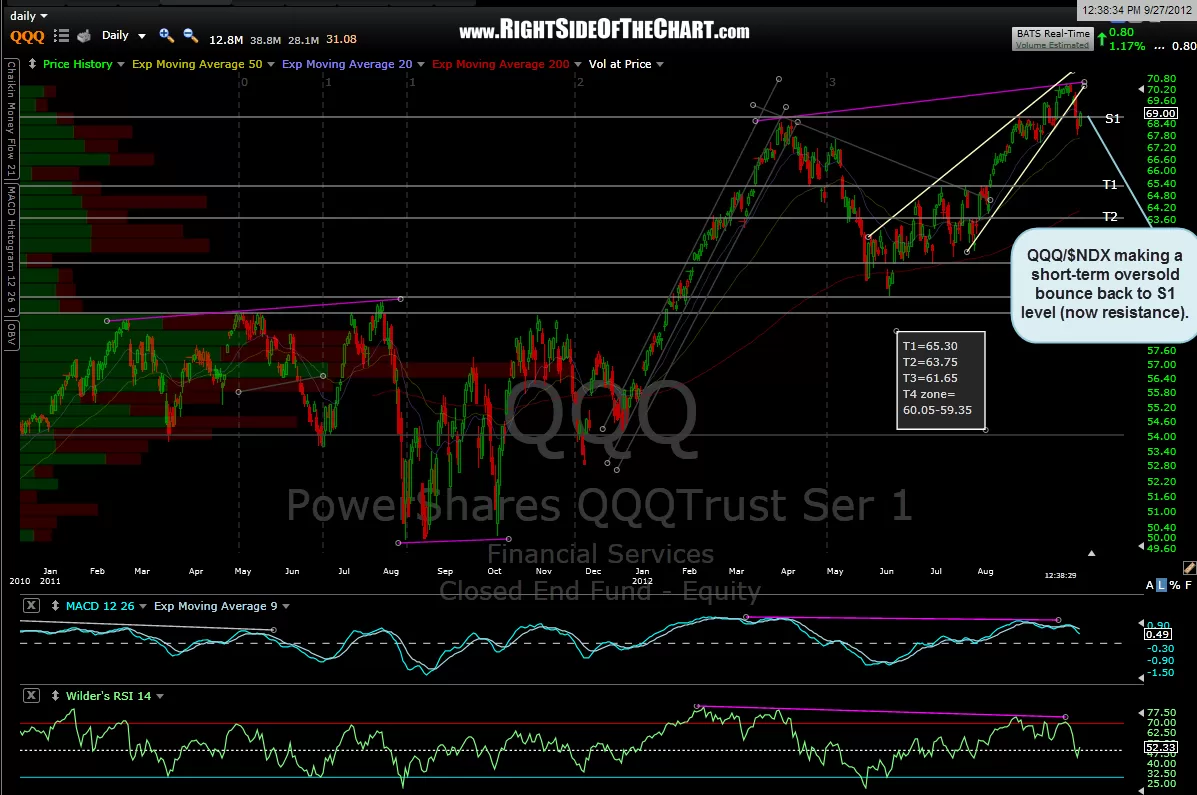
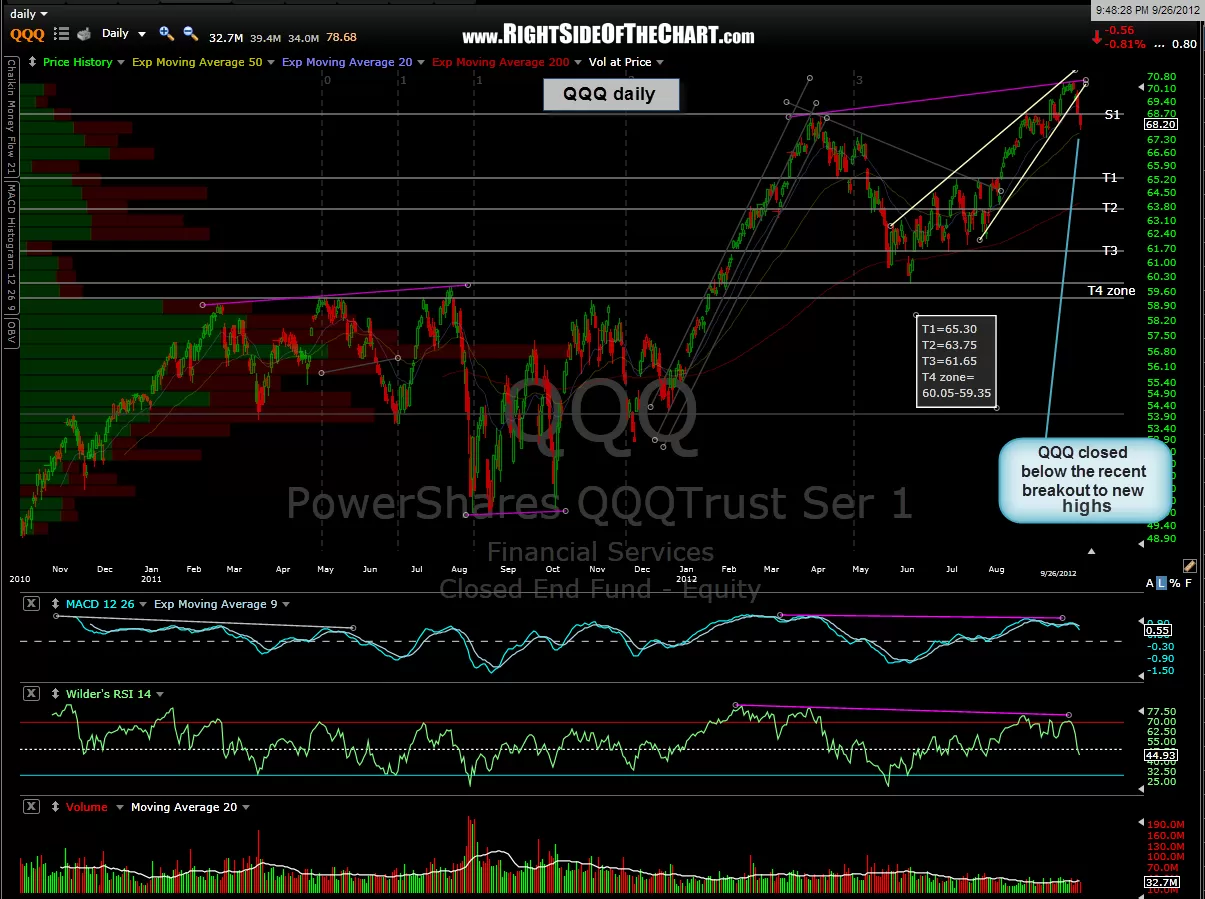
One last thing to add to that is the fact that I continually talk about how the markets are dynamic, not static, and as such, I am constantly evaluating the technicals and market action in order to adjust or outright change my take on where prices are likely to go next. For weeks I have been calling for a drop down to T3 before any meaningful bounce. Then, just last week as we started to approach that level, I gave almost even but slightly more favorable odds to a move down to T4 before any meaningful bounce. The reason stated for that belief was that both the broad markets and AAPL had about another 3% before reaching those price targets (T1 on AAPL, T4 on the QQQ). However, from there, AAPL went on to hit the horizontal support line towards the close on Thursday and then the primary uptrend line on Friday morning while the QQQ lagged behind on the downside over the previous couple of days and thereby hit T3 while AAPL (the leader) hit T1. This, along with price action in the market and numerous other variables, is why I decided to completely close out the AAPL short on Friday morning and reverse it to a long trade in addition to stating that the risk vs. reward no longer warranted remaining short at that point.
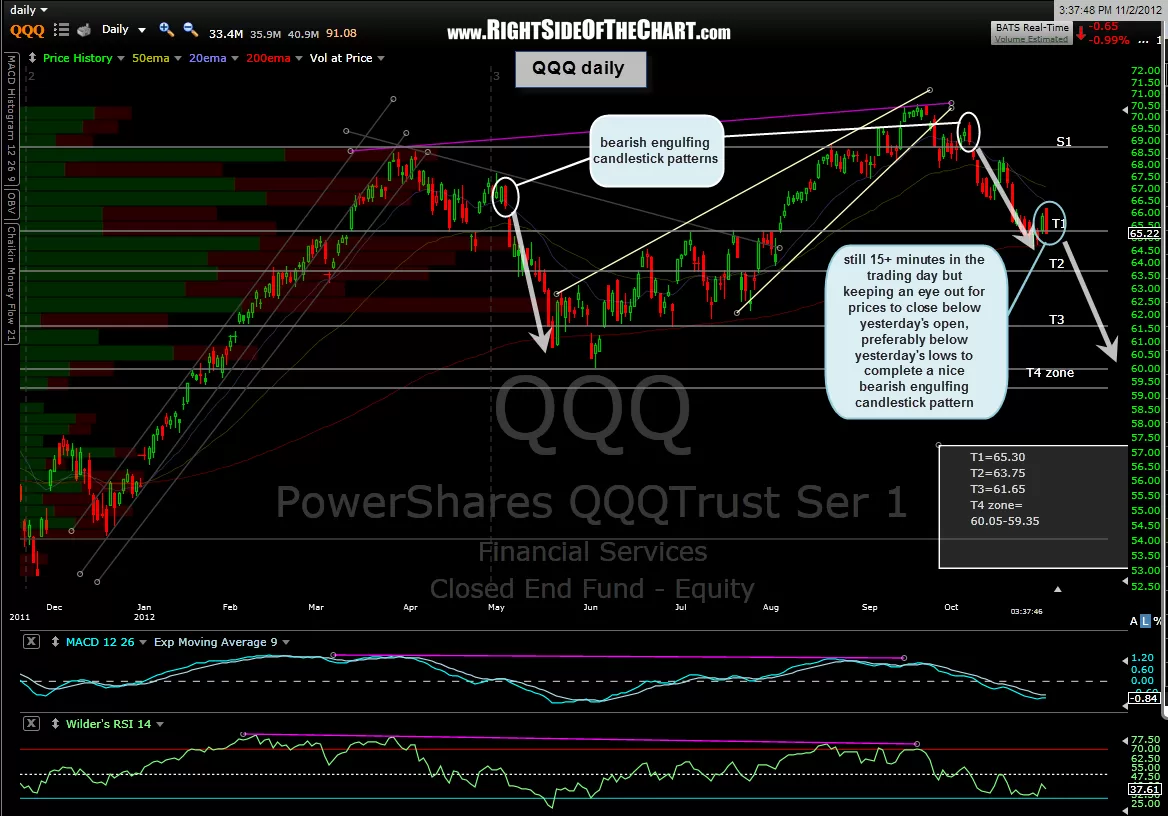
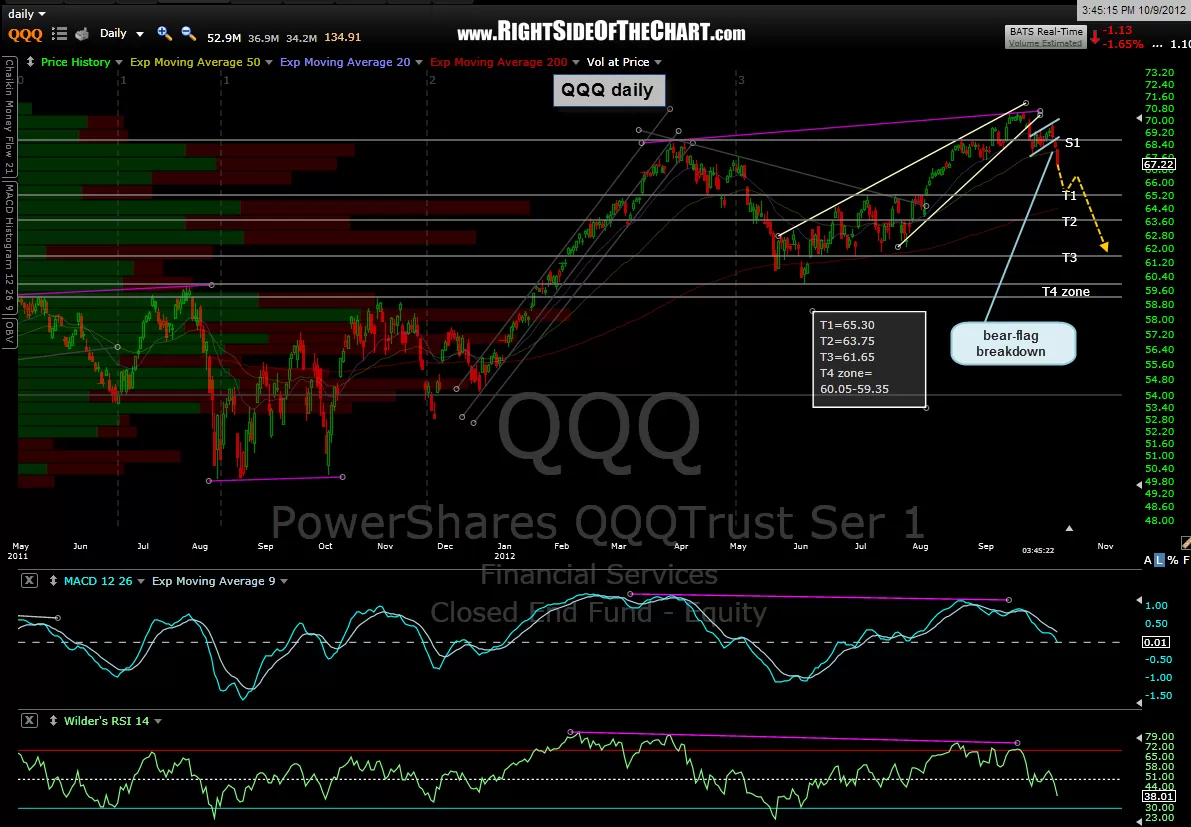
I understand that the sudden reversal from my previous scenario, although that scenario was only slightly favored over a bounce off T3 to begin with, might be frustrating to part-time traders or investors who don’t check the site on a regular basis the site or have not signed up to receive the email alerts notifications for new posts (much easier) but this is a perfect example of being flexible and adaptive when trading. For reference, I have included all 11 of the current series of QQQ daily charts in order as posted. The final chart (11th) is the most recent illustrating the three likely scenarios discussed above, with bounce price targets listed: