
The near-term pullback target on the QQQ 60-minute chart was just hit with a reaction likely off this initial tag from above. Previous & updated 60-minute charts:
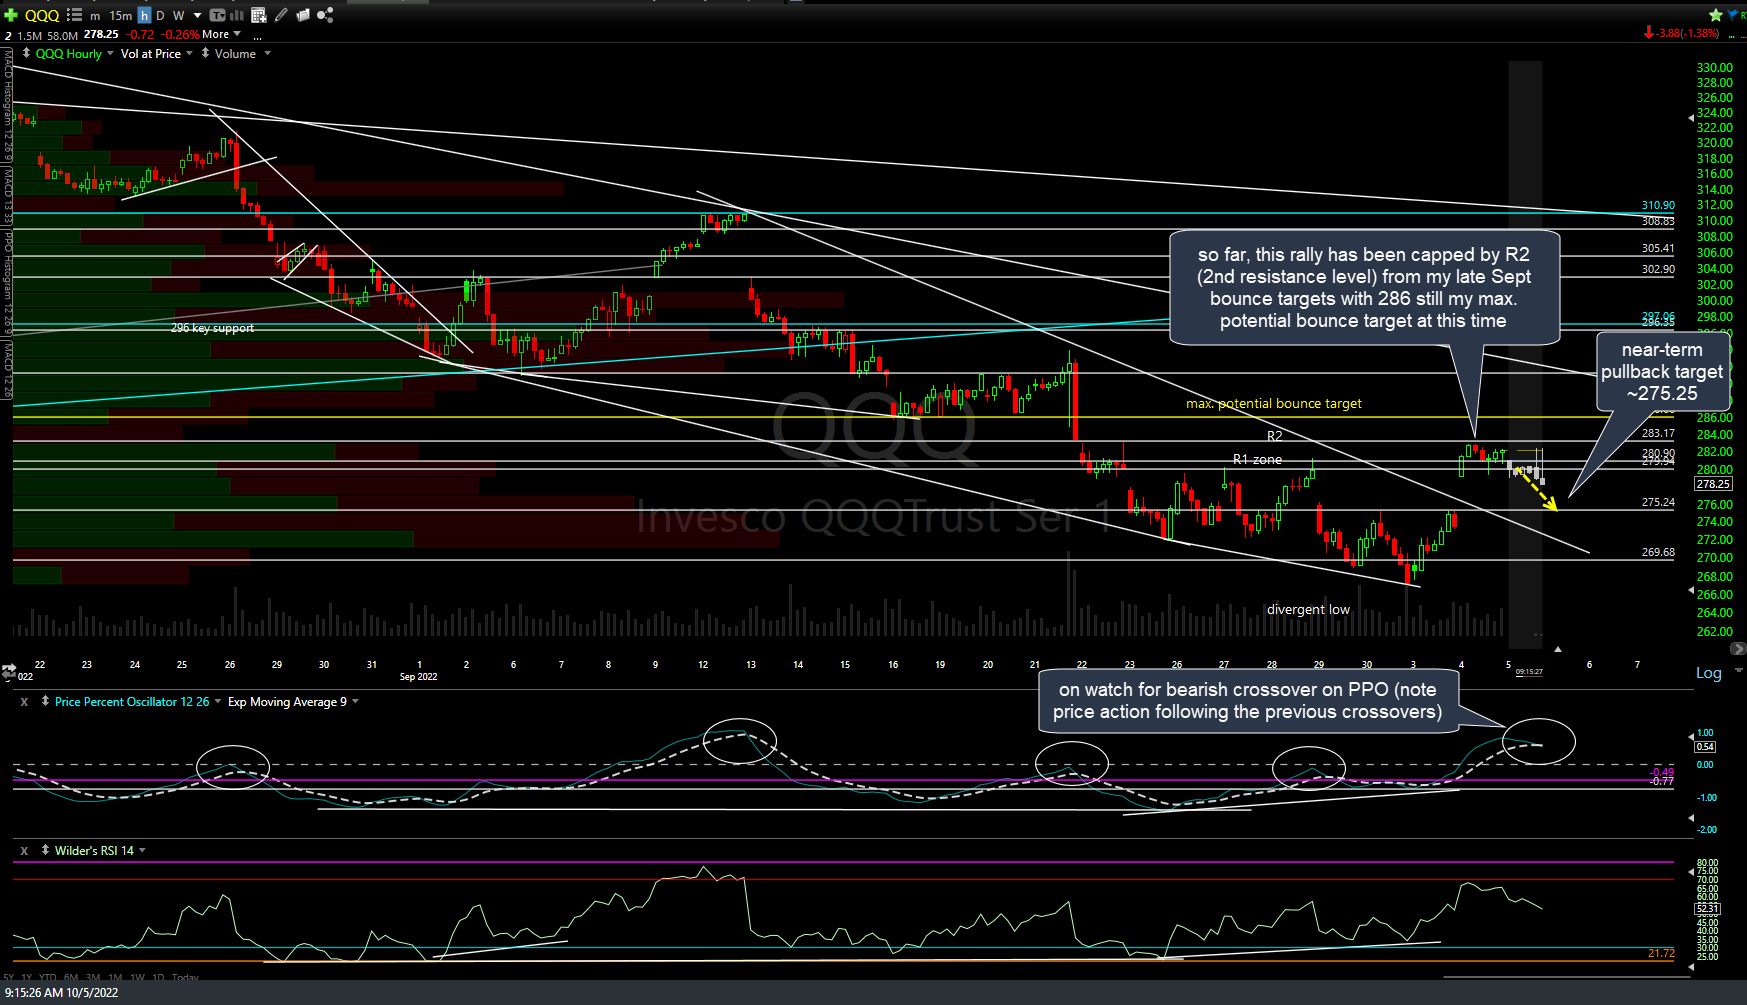
QQQ 60m Oct 5th
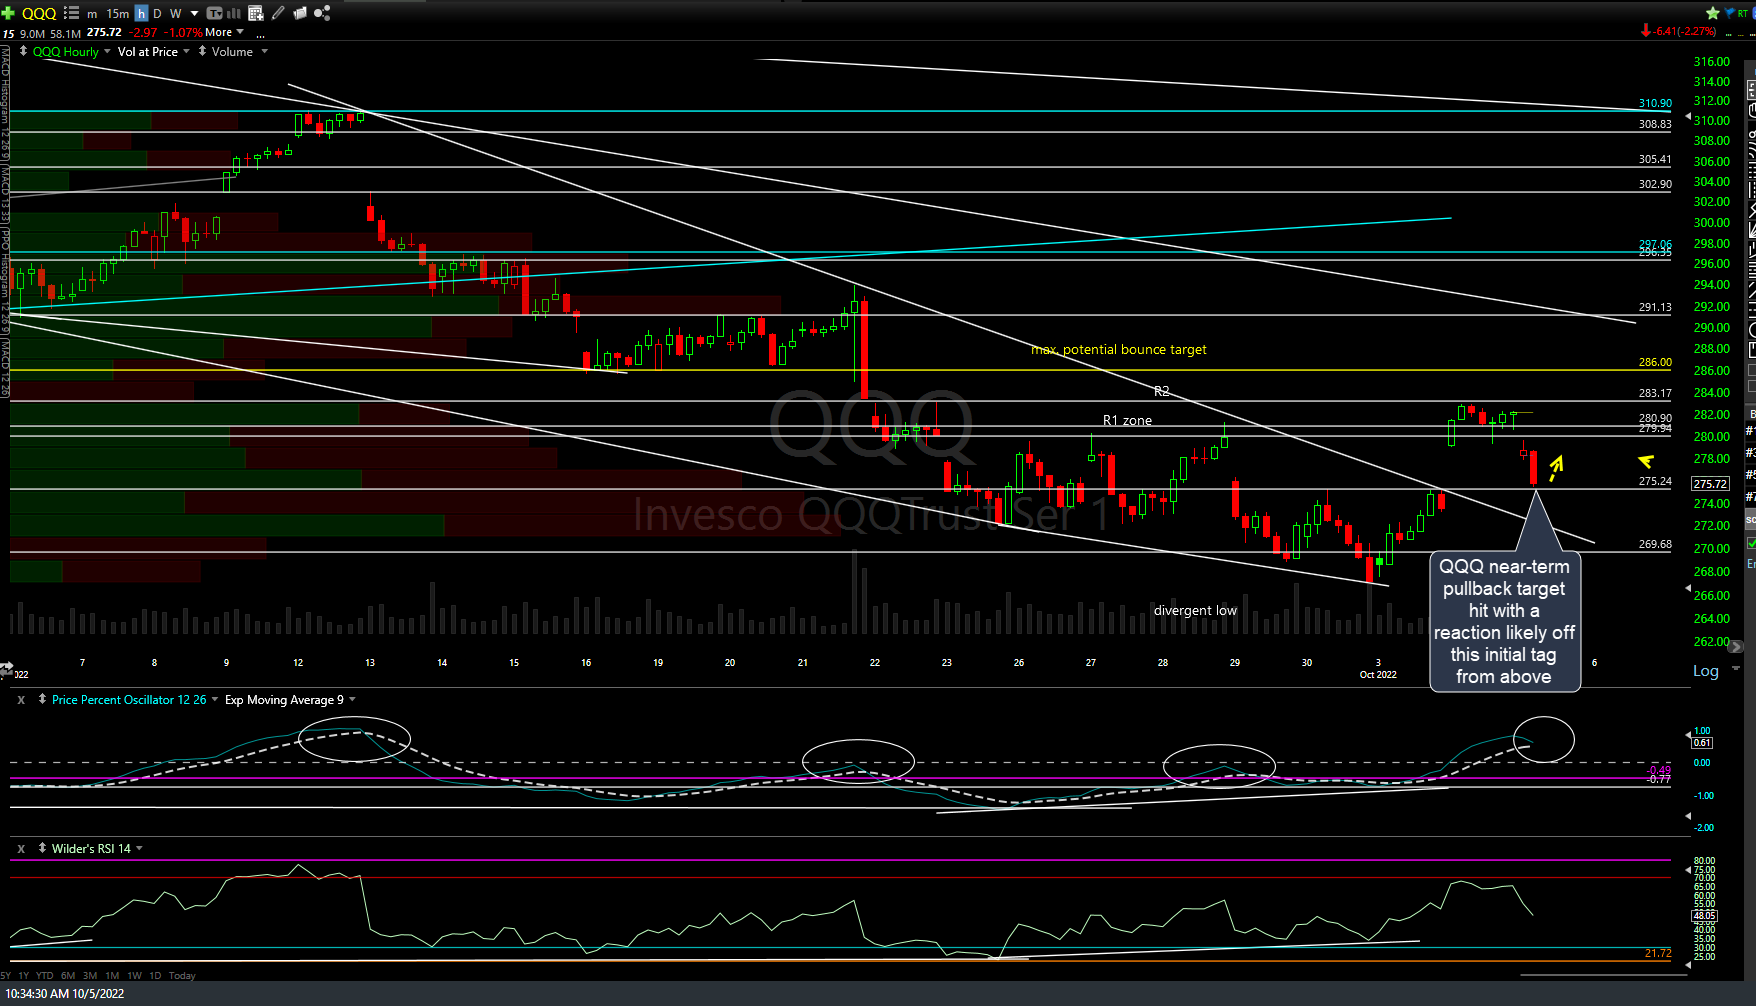
QQQ 60m 2 Oct 5th
Upon further review of the charts, I added a new support level & min. pullback target for /NQ here at ~11350, which coincides with the 274.25 pullback target on QQQ which was just hit. i.e.- this is an objective level for active traders to cover a short and/or reverse to long for a bounce. Updated 60-minute chart below:
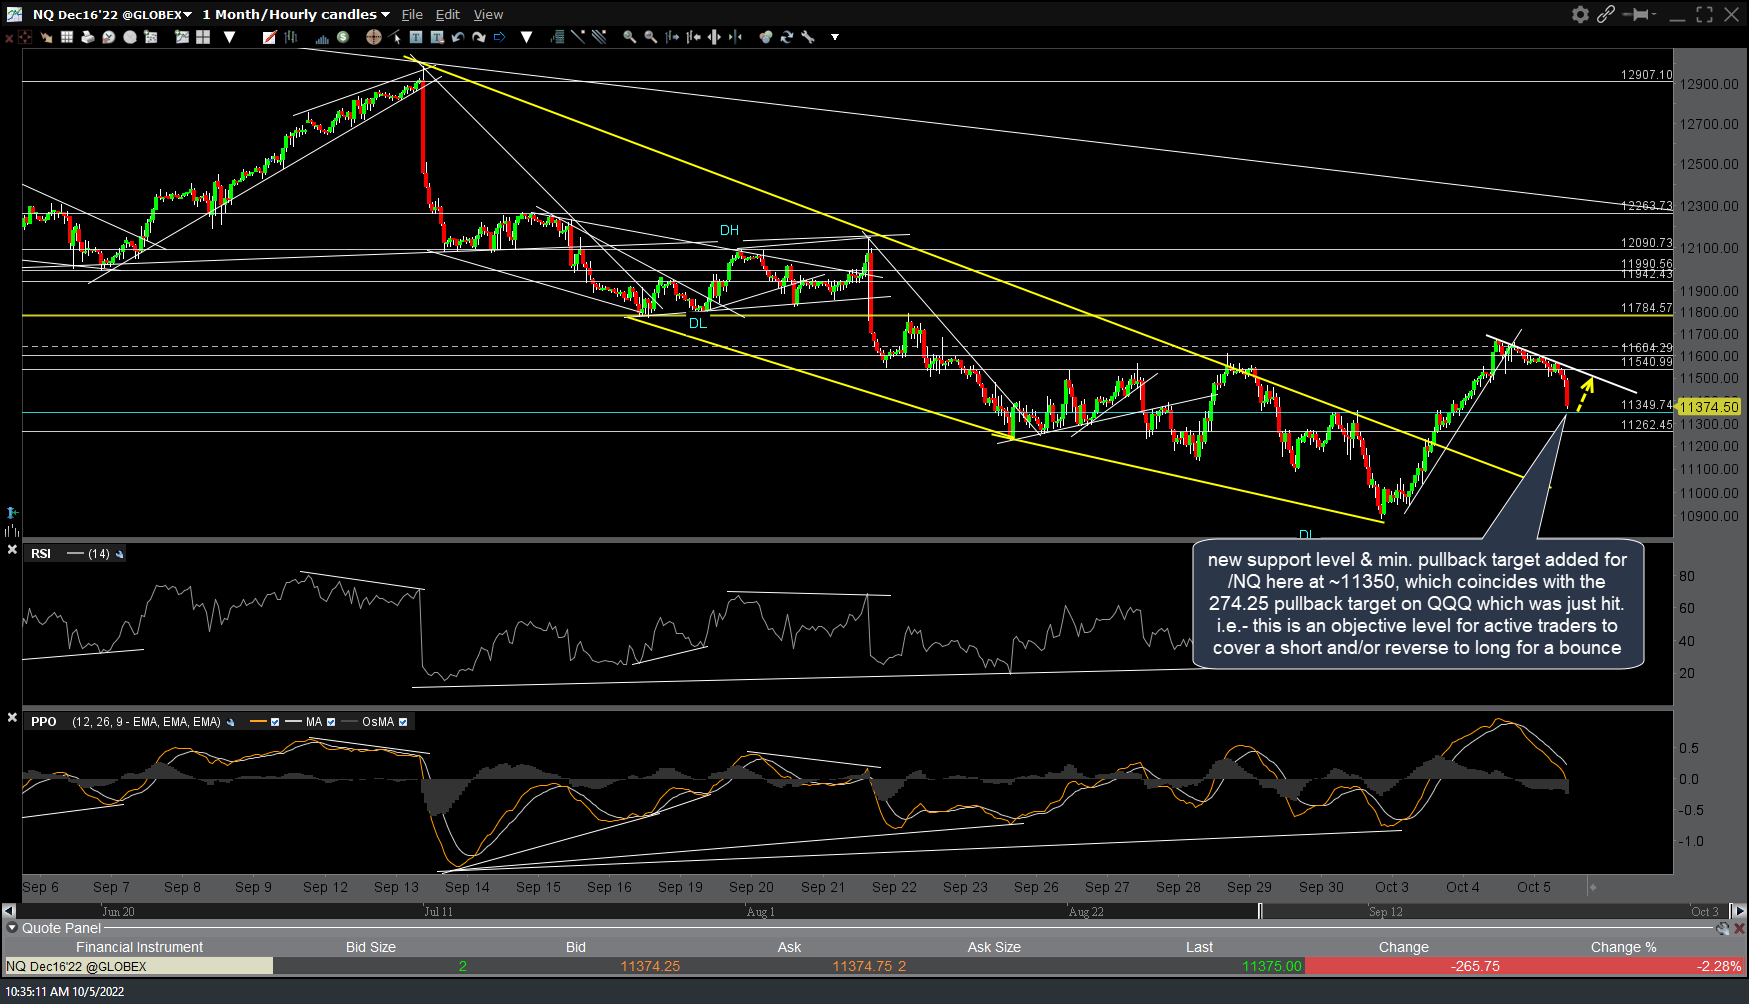
NQ 60m 2 Oct 5th
Bounce or no bounce, as of now I still favor considerably more downside in the coming days to weeks in the stock market, down to at least (~235) T4 on the QQQ weekly chart. As such, typical swing & trend traders might opt to continue to sit tight on short positions and/or use rallies into resistance to add to a partial position.
With the positive divergences in place on the recent successful test of the mid-June lows, those bullish could stay long with stops somewhat below the recent lows.