
The PPO histogram on the monthly chart printed another (4th consecutive) red close today (end of June), keeping that particular trend indicator on a sell signal for now. All other major index tracking ETFs (SPY, IWM, VTI, etc..) also finalized the month of June with another red (bearish) histogram print on the monthly PPO. Of course, that’s only one of many trend indicators that I use on the long-term charts, with most on the monthly time frame still bullish for now.
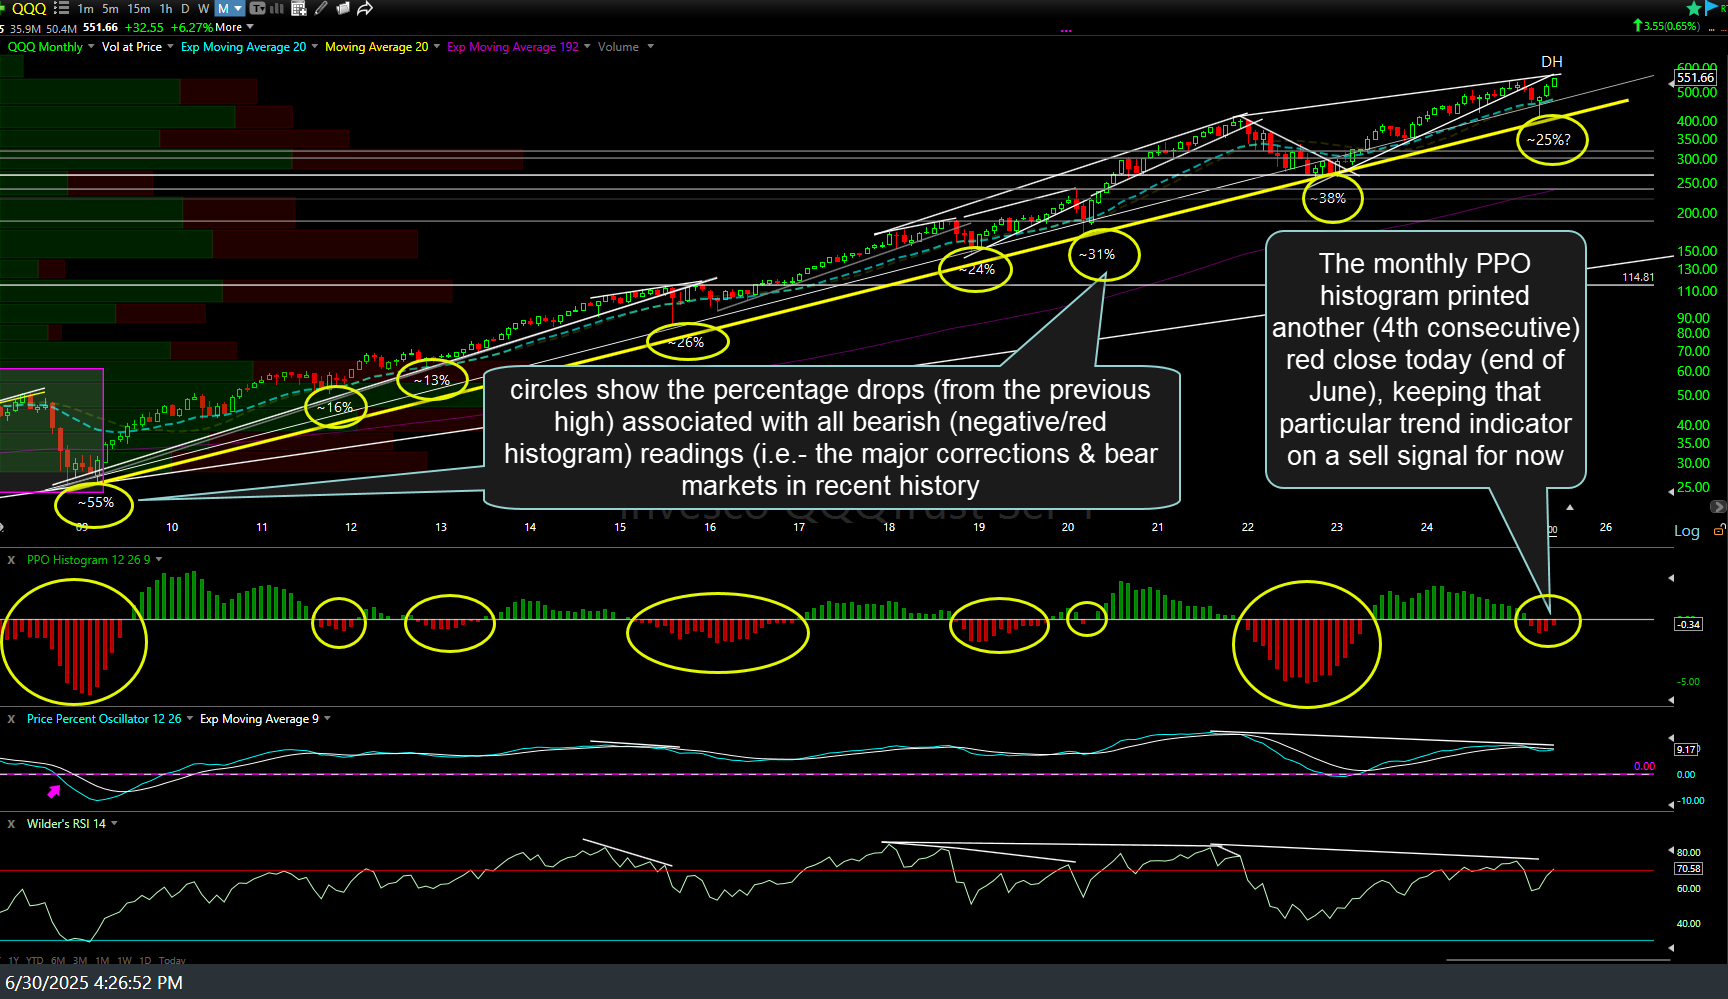
QQQ monthly June 30th
Zooming down to the weekly time frame, I’ll be watching to see how the weekly candle of QQQ prints at Friday’s close (when finalized) with the Q’s making the first backtest of the key uptrend line off the Jan ’23 lows since it was broken back in early March. A solid recovery back above the trendline (again, on a weekly closing basis) would be bullish, while a solid rejection would certainly help the longer-term bearish case. However, there’s still plenty of work to be done, especially a drop back down below the 40-week/200-day moving averages.
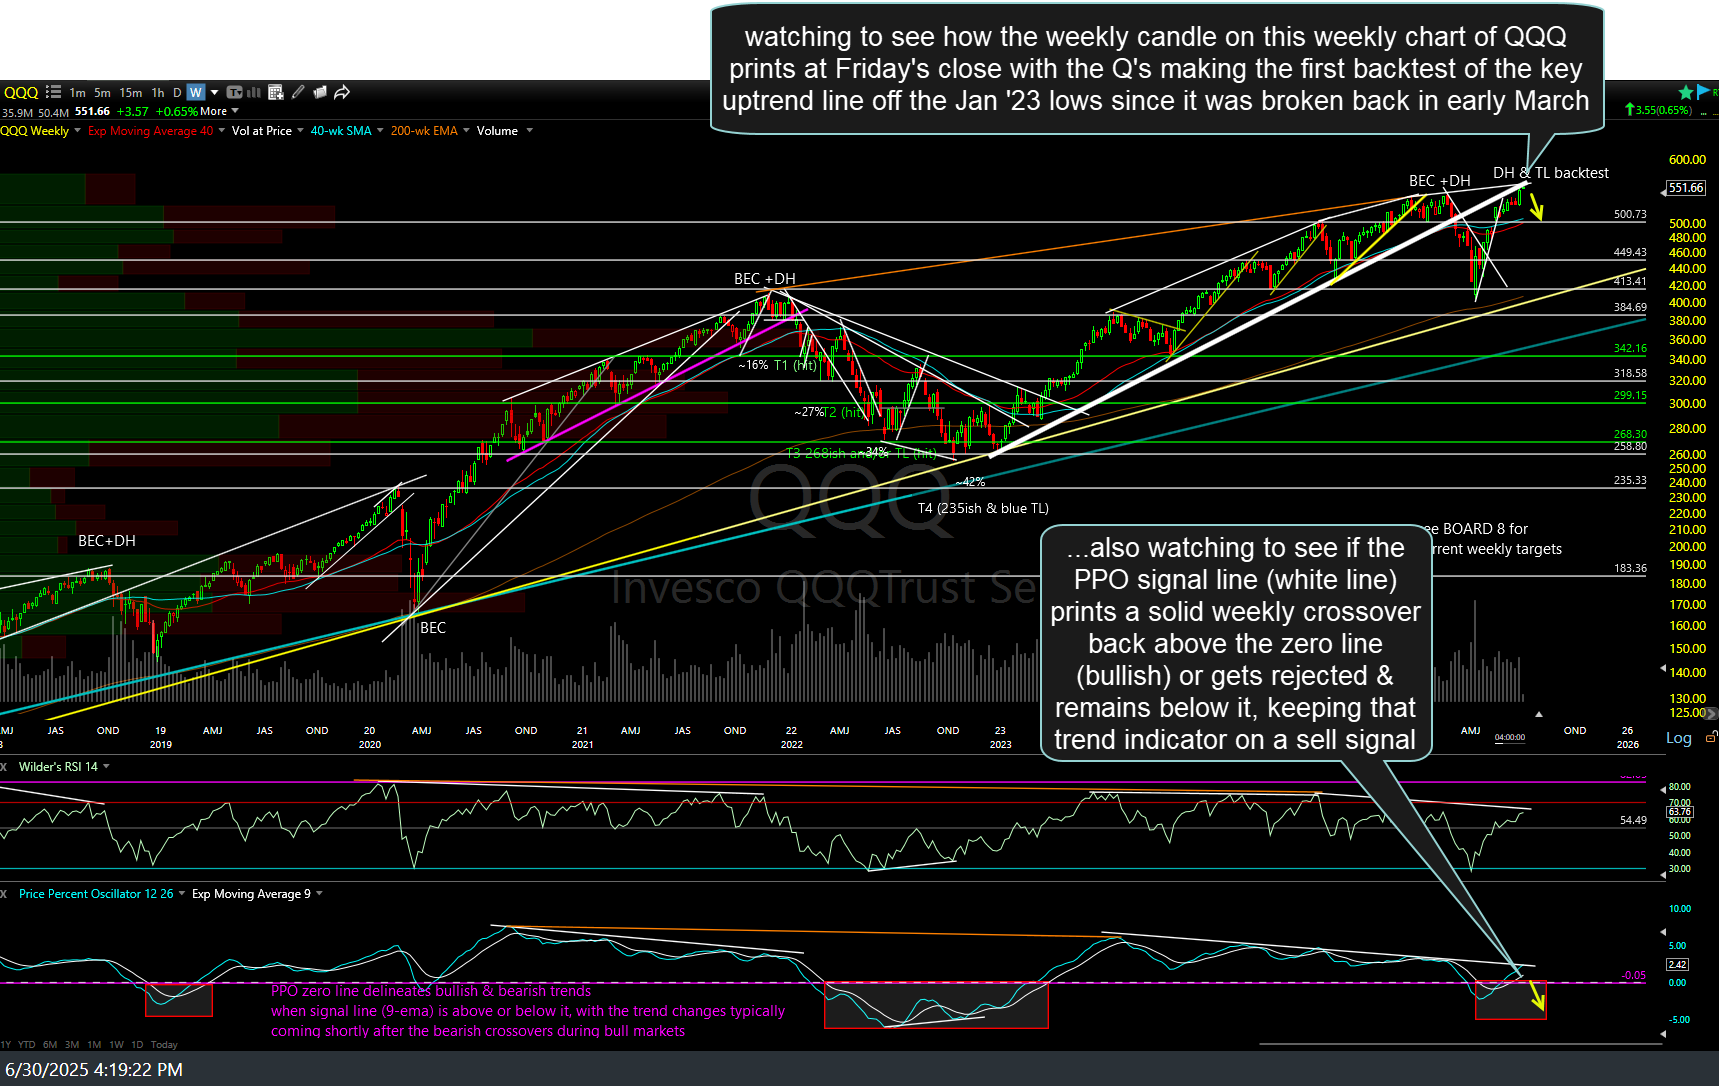
QQQ weekly Aug 30th
I’ll also be waiting to see how the weekly signal line (white line) prints at Friday’s close, with the Q’s making the first backtest of the key uptrend line off the Jan ’23 lows since it was broken back in early March. As covered in recent videos & seen on the chart above, the PPO signal line does a good job of delineating the larger bullish & bearish trends when above or below the zero line.