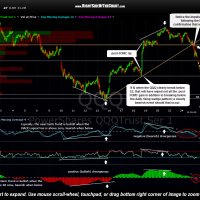
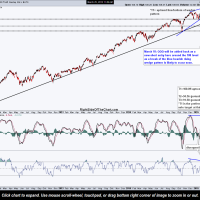
So far the QQQ scenario is playing out just as expected, with a near-immediate resumption of the selling shortly after the open today on the heels of yesterday’s breakdown shortly before the close. As this 15-minute chart highlights, the impulsive selling that followed the breakdown helps to validate the fact that those intersecting support level were indeed important technical levels for the QQQ.
- QQQ 15 minute March 25th
- QQQ daily March 25th
Since mocking up this 15 minute chart, the Q’s have gone on to slice through the first support level, S1 at 107, further validating the previous prediction that the selling was likely to begin to accelerate once those intersecting supports at the 108 level were clearly taken out. My expectation from here is to see a continued move lower to the S2 level, which comes in around 106. If that happens, there will be two significant technical developments that will have occurred, both with additional bearish implications.
First, a move down to the 106 area will have wiped out 100% of the post-FOMC rally that was sparked by the Fed announcement last Wednesday afternoon (the large green candlestick & subsequent rally highlighted on this chart). Simply put, all those who bought into the post-FOMC rally will be underwater on their position if & when prices reach the 106 level.
Additionally, a move down to the 106 level will also bring the Q’s to the bottom of the bearish rising wedge pattern that I’ve been highlighting on the daily time frame for while now. My expectation is for at least a pause or bounce off the initial tag of the 106 area as it is both horizontal support (as shown on this 15 minute chart) as well as uptrend line support (the bottom of that daily rising wedge pattern). Whether or not the Q’s bounce off the initial tag of those dual support levels, I continue to favor a ultimate downside break of the daily bearish rising wedge pattern and a continued move lower to at least the 100 area, which is the first target (T1 at 100.09) for the QQQ Active Short Trade.


