
One likely scenario would be a brief pop above this recent trading range in QQQ to put in one last divergent high as well as a false breakout/bull trap with prices snapping back into & ultimately below the bottom of the range (113.50ish). 4-hour period chart:
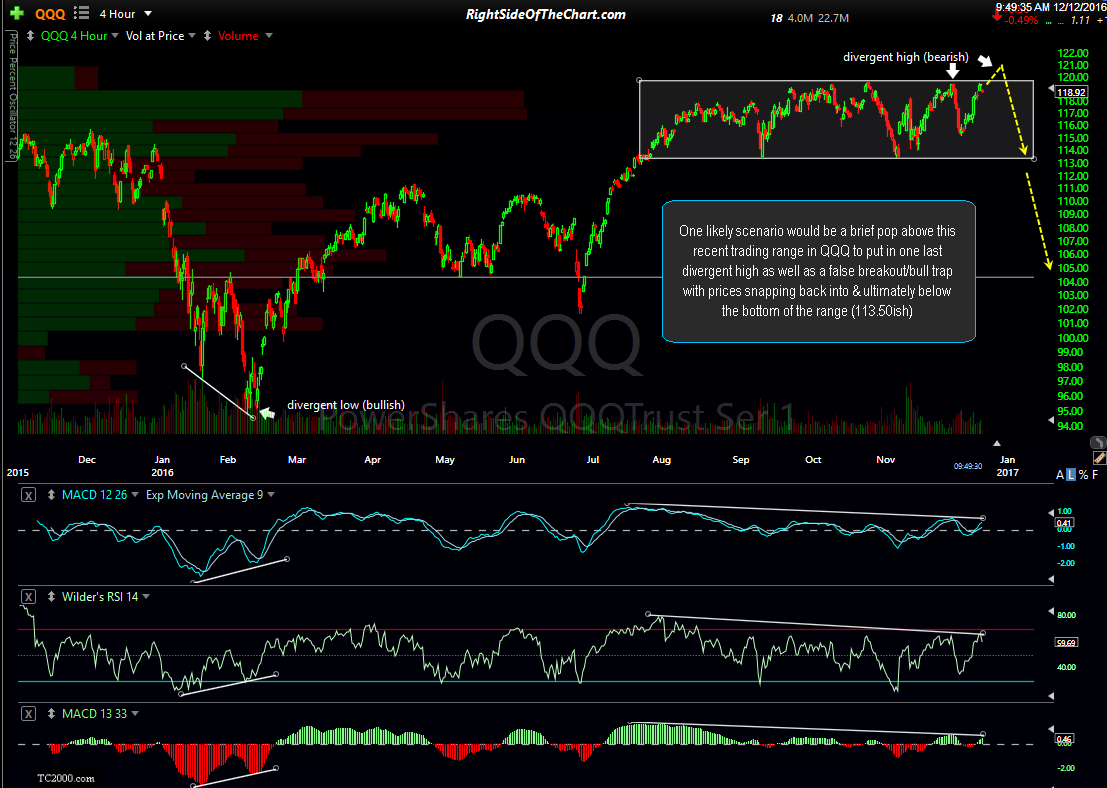
QQQ 4-hour Dec 12th
IWM continues to test the minor uptrend line support that it closed on at the end of trading last week. Preferred scenario in yellow, alternative scenario in blue which calls for one more divergent high before IWM moving lower & breaking down below the rising wedge pattern. 60-minute chart:

IWM 60-minute Dec 12th