
QQQ is currently backtesting the 200-day EMA (potential resistance) from below with the 200-day SMA & bottom of topping/trading range (resistance) just above. This is where I had the first likely reaction on the recent posted daily charts from a couple of weeks ago (below) occurring with my preferred & still current oversold bounce scenario. However, based on the developments of the 60-minute chart (at bottom of this post), I suspect the Q’s will likely power through the 200-ema due to today’s breakout. Previously posted (March 12 & 14th) & updated daily chart below.
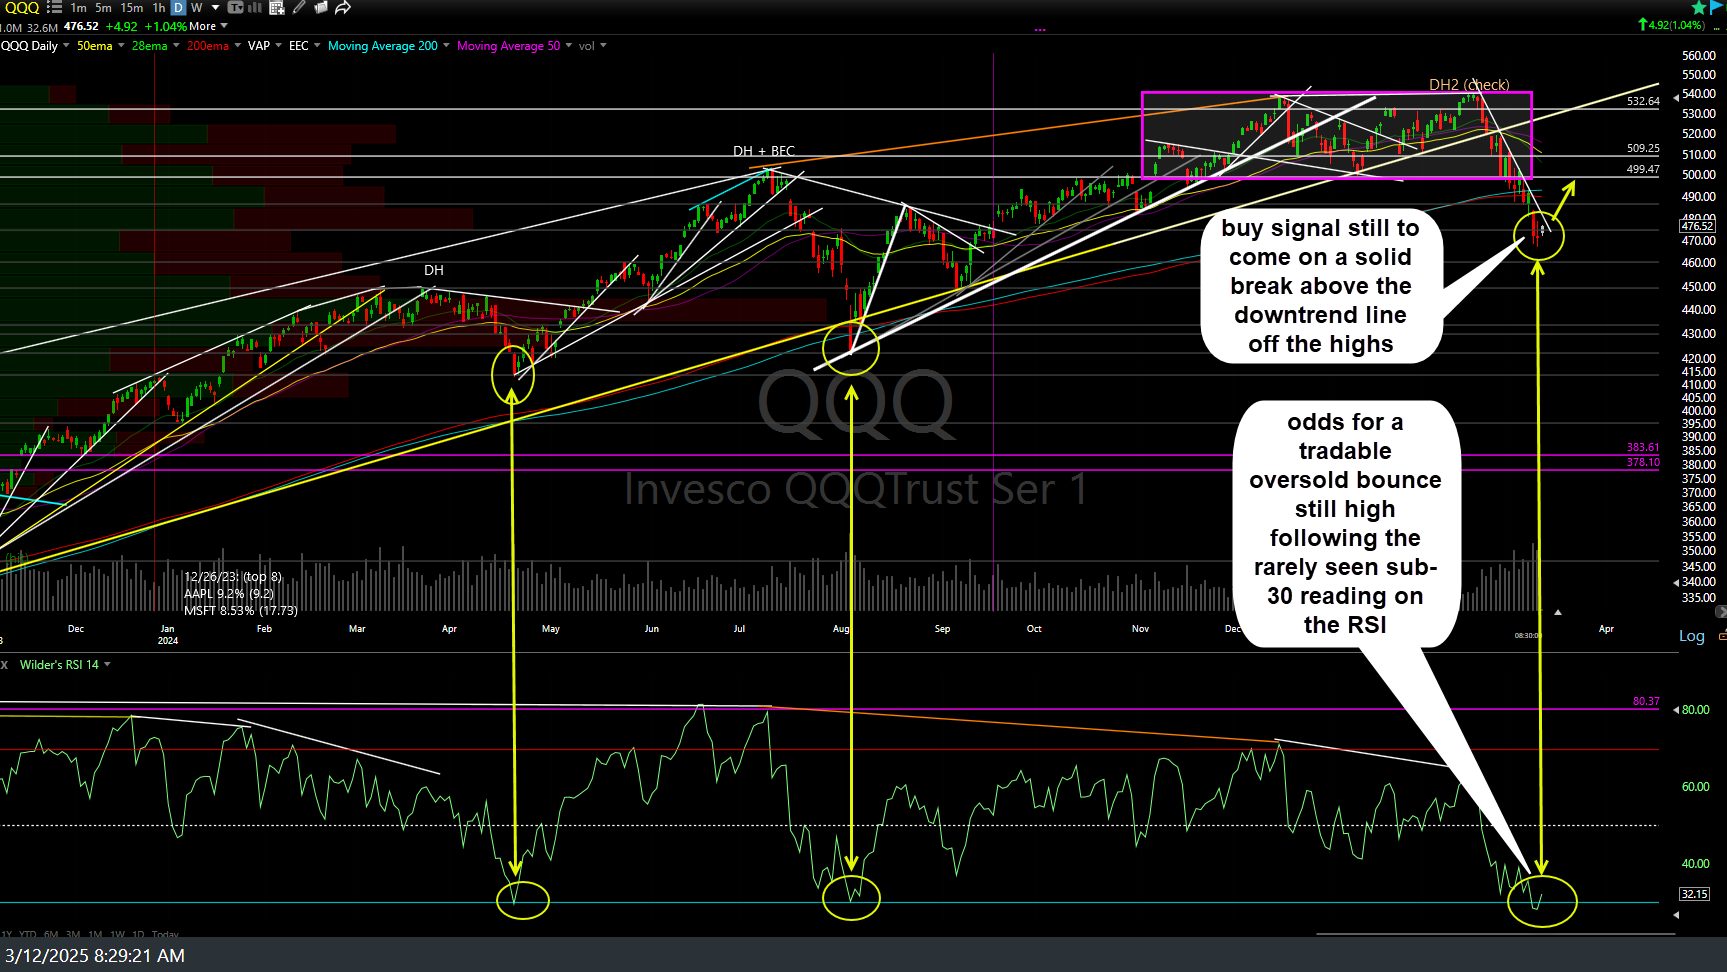
QQQ daily March 12th
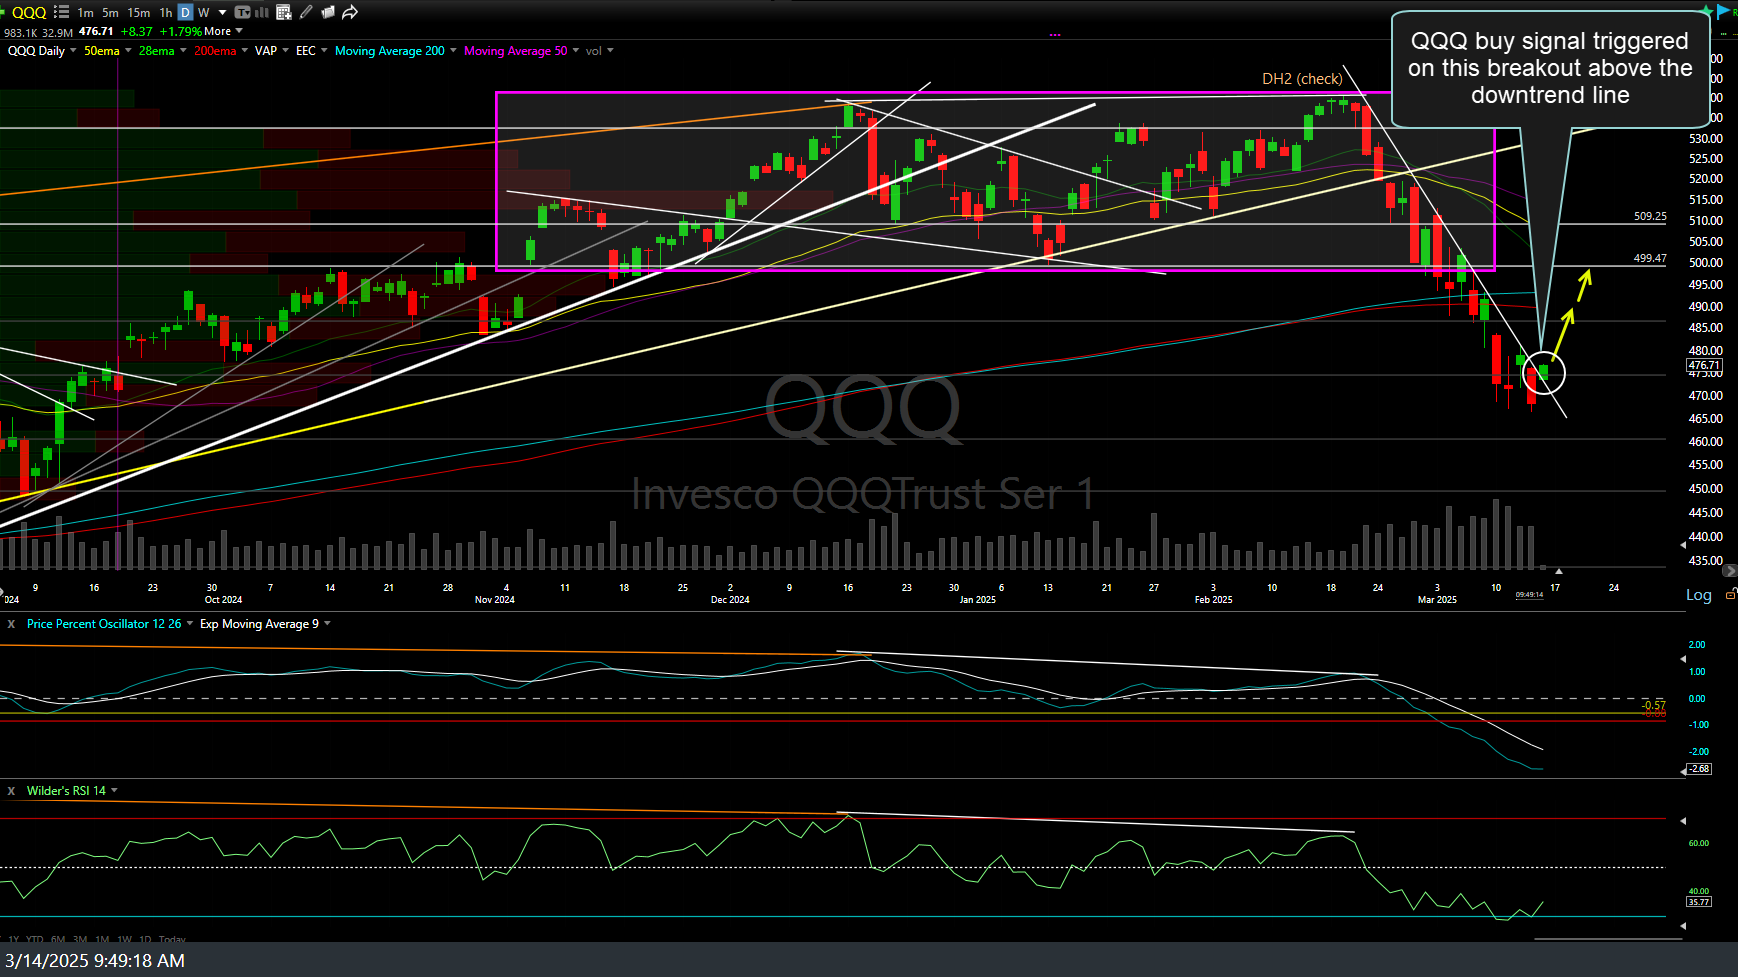
QQQ daily March 14th
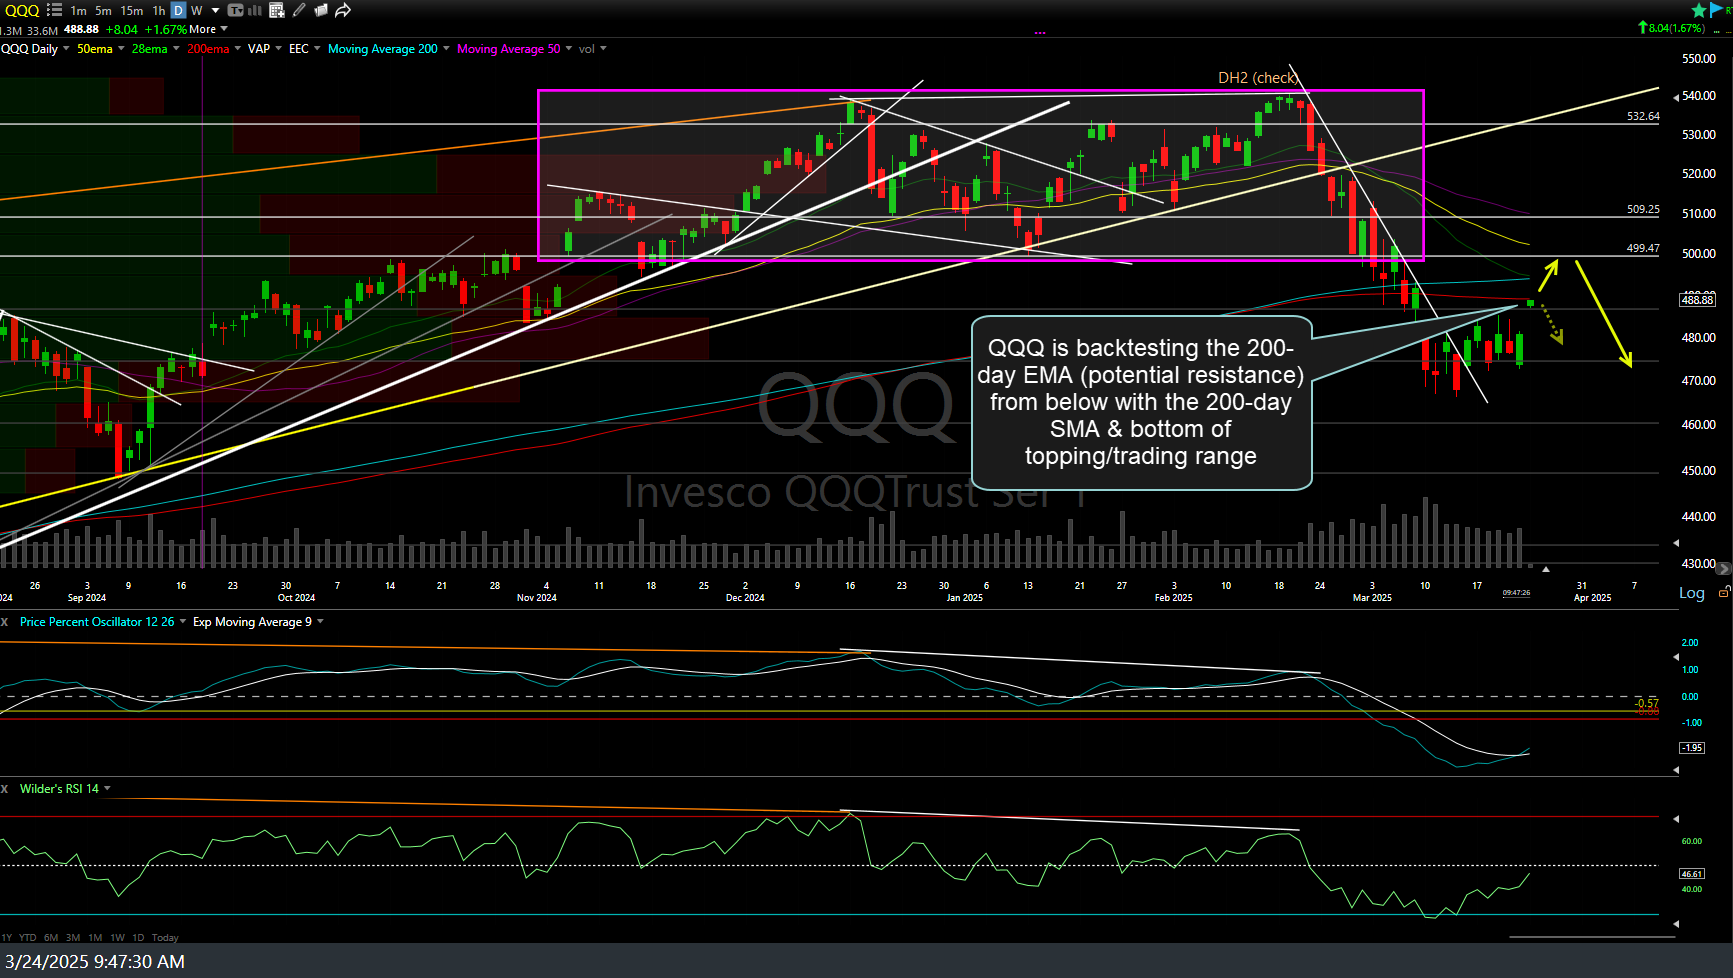
QQQ daily March 24th
I still prefer about a 6-7% bounce off the recent lows & the 60-minute chart of QQQ below has my current “preferred” and “maximum” bounce target zones. I wanted to get these charts out today & will follow up with a video today as I will away from my desk, at minimum, all day tomorrow & possibly Wednesday, which is likely to be around the time my long-side bounce targets (and objective re-entry on the short positions) may occur, assuming they are hit.
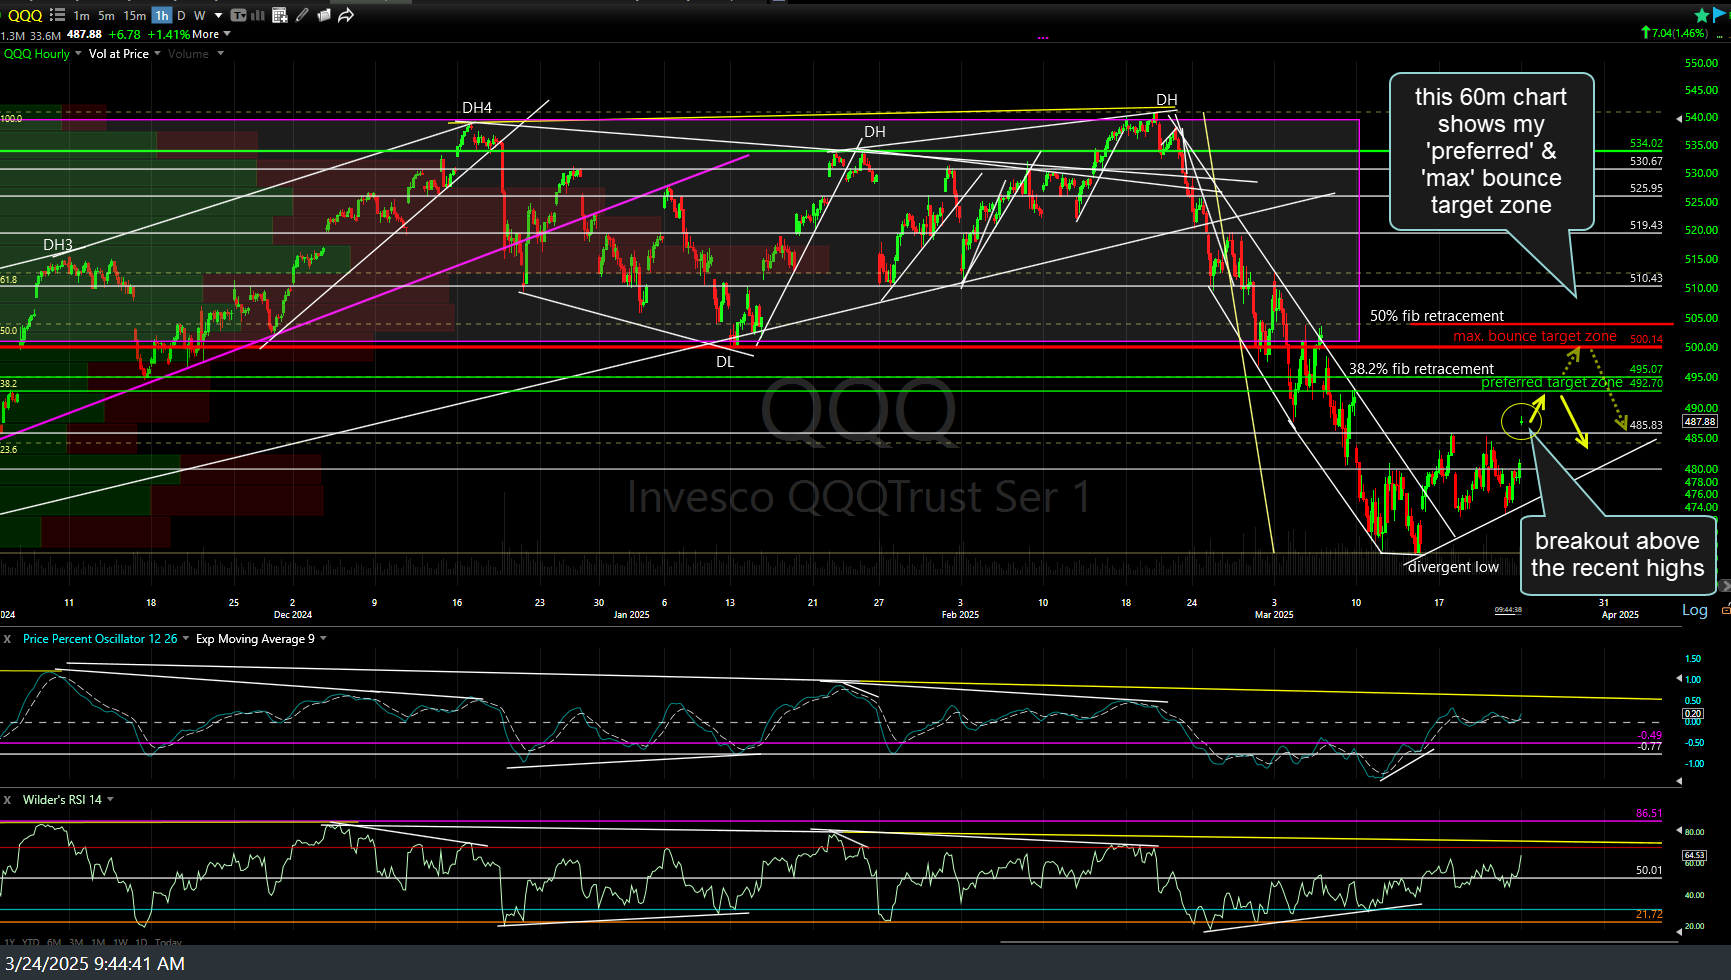
QQQ 60m March 24th