
Following a big intraday rally of +2.7%, QQQ reversed & closed right around the top of today’s gap. Although giving back about 3/4ths of the today’s early gains, it still managed to close positive with a decent gain of 0.65% so one can’t read too much into today’s price action other than the markets continue to trade in a very erratic but upwards trading range since last Monday’s lows. Tomorrow will likely see QQQ gap up & run following this closing test of today’s gap (green/my primary scenario) or gap down to test & quite likely break below the bottom of the gap/Friday’s close.
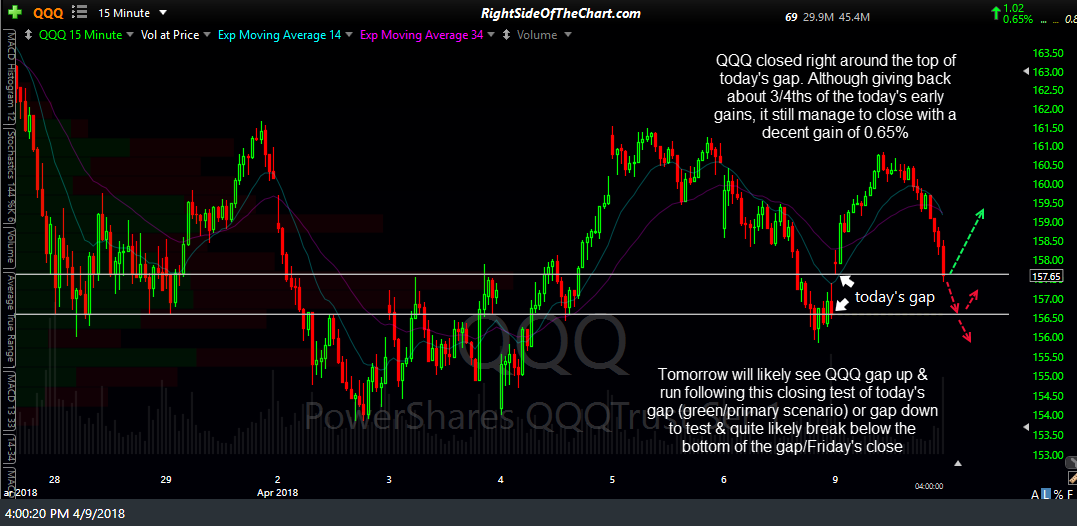
QQQ 15-min April 9th
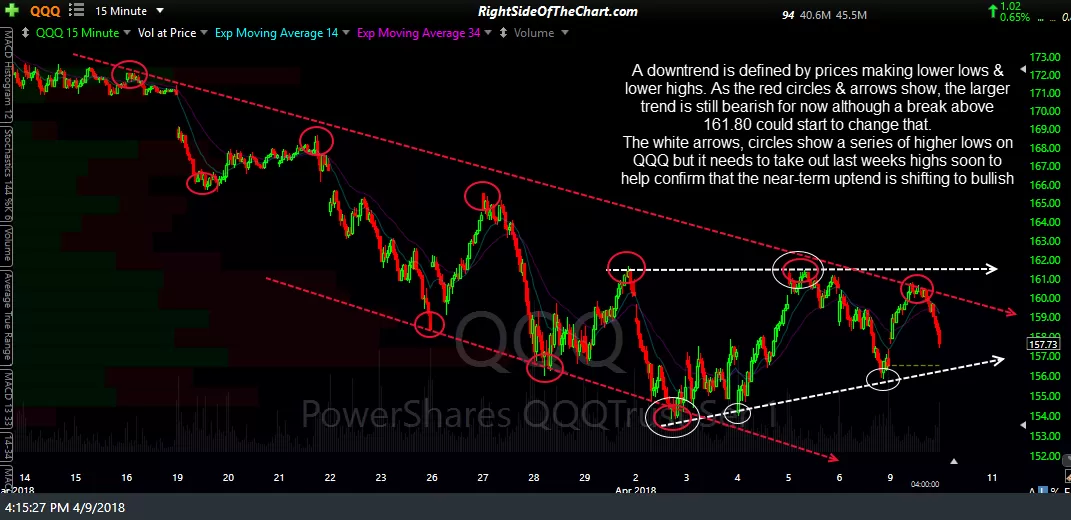
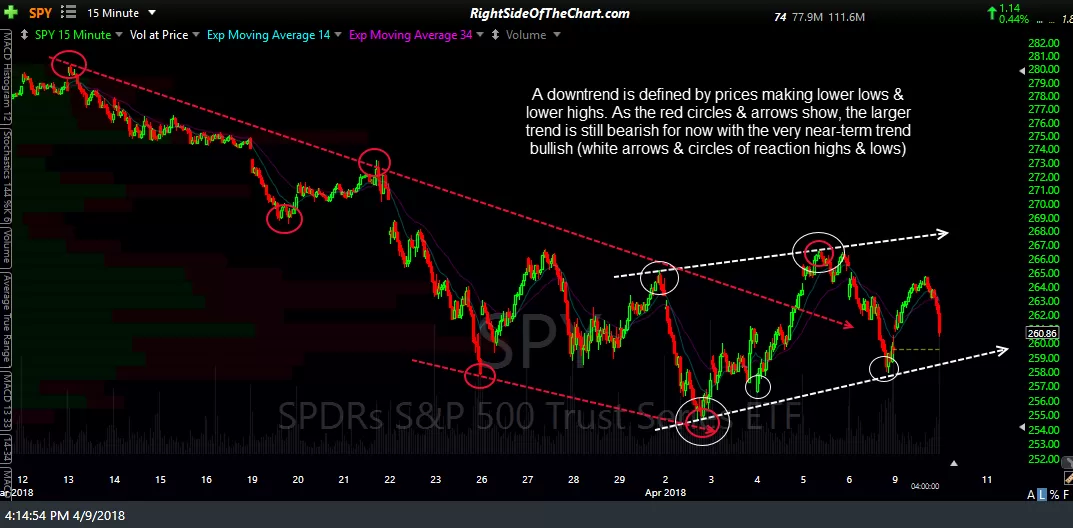
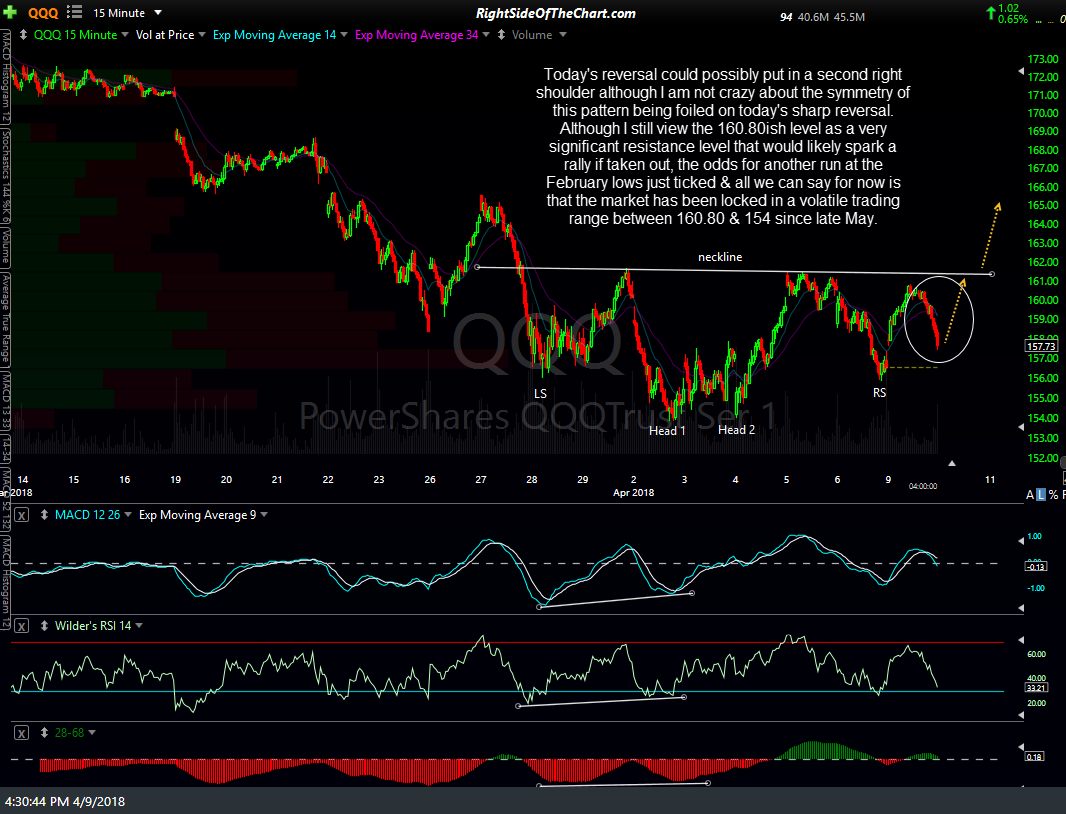
A downtrend is defined by prices making lower lows & lower highs. As the red circles & arrows show, the larger trend is still bearish for now although a break above 161.80 could start to change that. The white arrows & circles show a series of higher lows on QQQ but it needs to take out last week’s highs soon to help confirm that the near-term uptrend is shifting to bullish while the very near-term (white) trend on SPY is slight more clear but still rests on last week’s highs being taken out before SPY drops no further than below the April 2nd lows & ideally not below either of the two previous reaction lows.
-
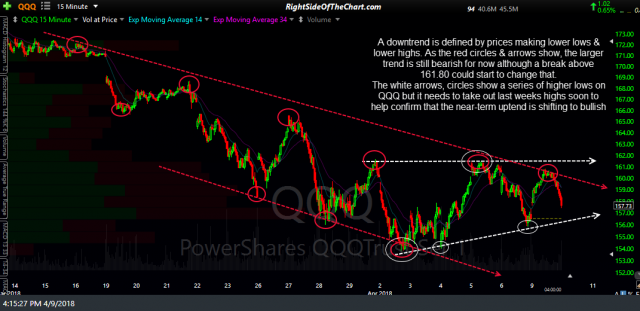
- QQQ 15-min trends April 9th
-
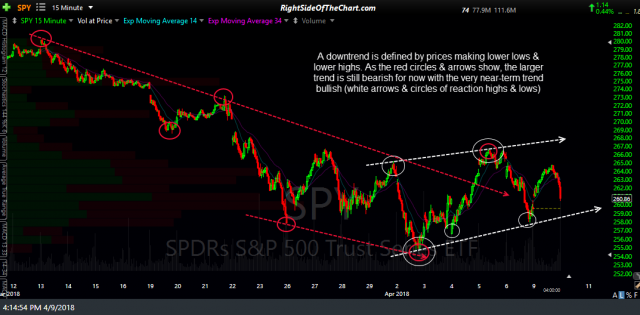
- SPY 15 min trends April 9th
Today’s reversal could possibly put in a second right shoulder although I am not crazy about the symmetry of this pattern being foiled on today’s sharp reversal. Although I still view the 160.80ish level as a very significant resistance level that would likely spark a rally if taken out, the odds for another run at the February lows just ticked up & all we can say for now is that QQQ has been locked in a volatile trading range between 160.80 & 154 since late May.
QQQ 15-min 3 April 9th
About the only thing we can say with a high degree of confidence is that the Nasdaq 100 & the rest of the market is likely to break below or above this range soon & whichever way it does break could determine whether the next 5%+ move is to the upside or downside. As of now, the daily & weekly charts are bearish & would indicate more downside to come over the next 1-3 months while the short-term charts are still constructive & could continue to lift the market in the coming days & weeks. As long as the near-term trends, as well as the bullish divergences on the intraday charts, remain intact, the likelihood of another 5% or so upside from where we closed today is still decent. Those are some big “IF’s” so best to continue to keep things relatively light until the direction of the next major trend starts to become more clear.