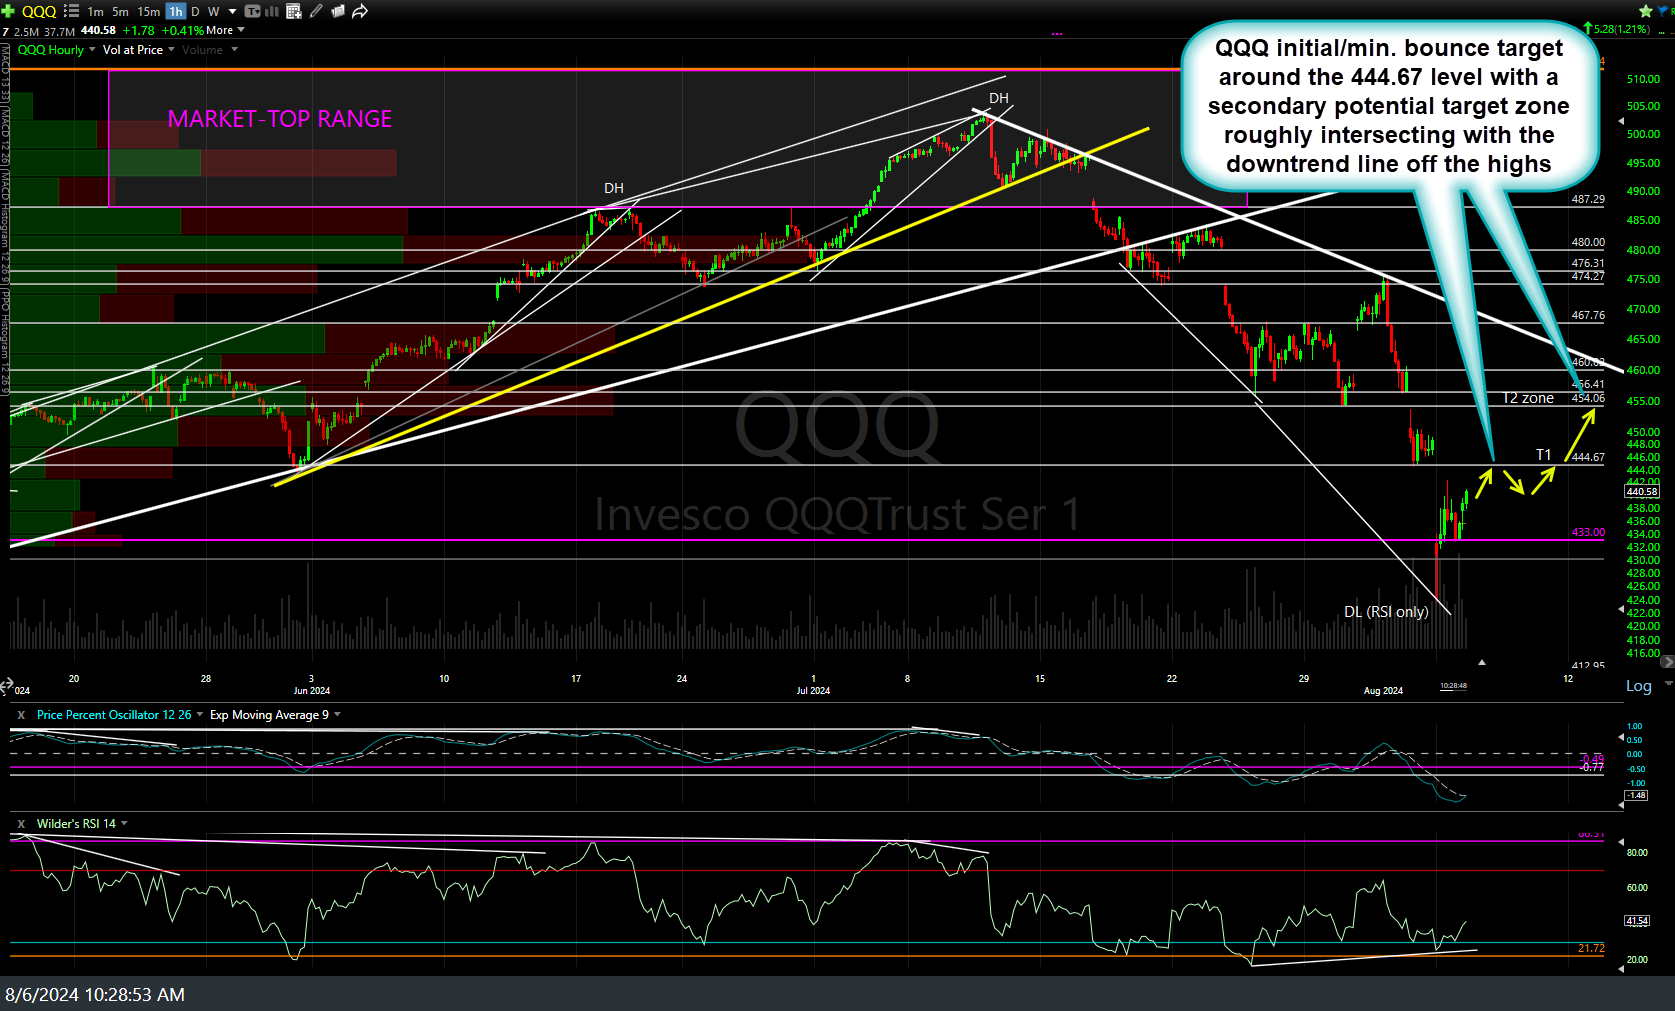
For the longs taken off yesterday’s lows, I’ve come up with two potential bounce targets based off the 60-minute chart with my initial/minimum bounce target around the 444.67 level with a secondary potential target zone roughly intersecting with the downtrend line off the highs.
I should also add that I am definitely not married to these or any upside targets at this time so my trading plan could change at any time, depending on how the charts develop going forward. As always, I will do my best to communicate any changes in my outlook or significant technical development that I notice asap.
In reviewing the long-term charts of the stock indexes as well as the top 30 or so components of both the S&P 500 and Nasdaq 100, it still appears to me that the stock market, and most of those top components, are sitting on the edge of a technical cliff: Many at or near (most above, some below) key uptrend line and/or price support with huge negative divergences on the weekly & even monthly charts, indicating the likelihood of a major bear market when & if the majority of those key stocks as well as the indices trigger sell signals & flip the trend change indicators from bullish to bearish on those longer-term (weekly & monthly) charts. As such & in light of the recent powerful & clear sell signal on the daily time frames, I view the current long trades as counter-trend trades that I’m looking to (once again, just like last week) trying to thread the needle & pick up a few more nickles in front of what could prove to be a potentially powerful steam roller.
I’ll probably follow up with some charts on SPY and/or /ES, /NQ, IWM, /RTY, etc.. in the comment section below this post. I’ll also try to reply to the recent questions & chart requests asap although the one asking for an update on Bitcoin & Ethereum, I did cover Bitcoin in one of the recent videos & stated that the cryptos would likely rally along with & as long as the stock market rallies as a return to the “risk-on” trade .


