
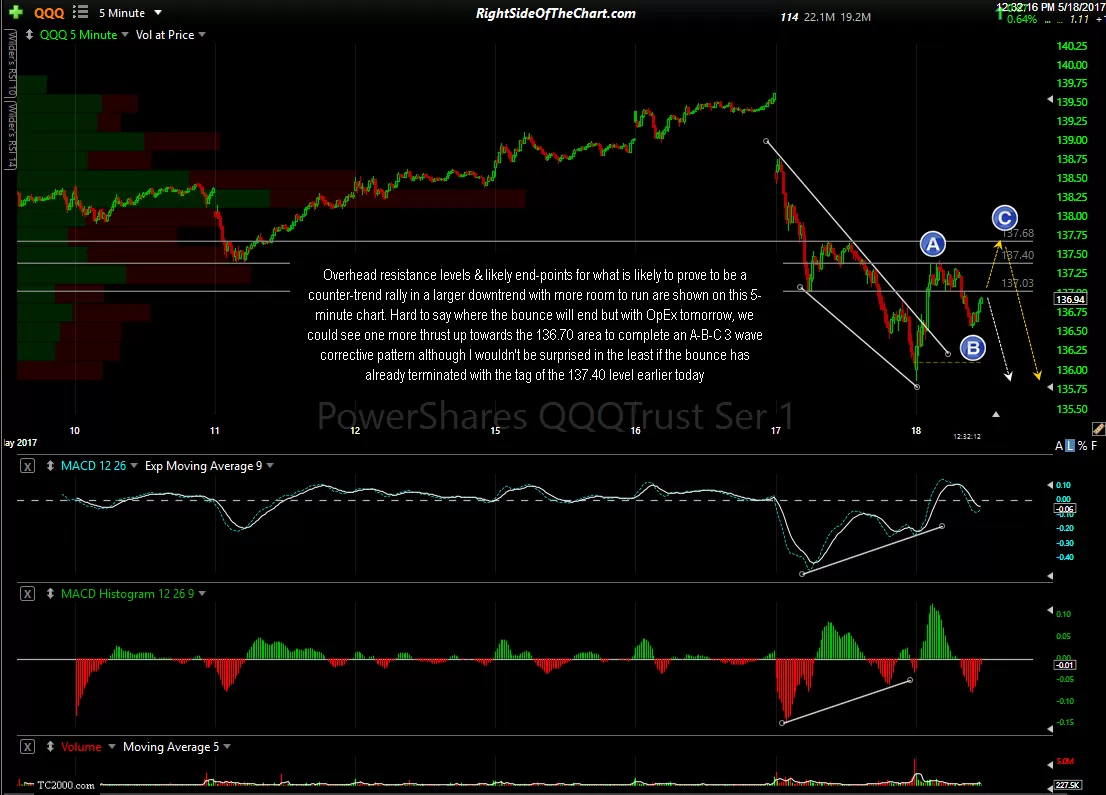
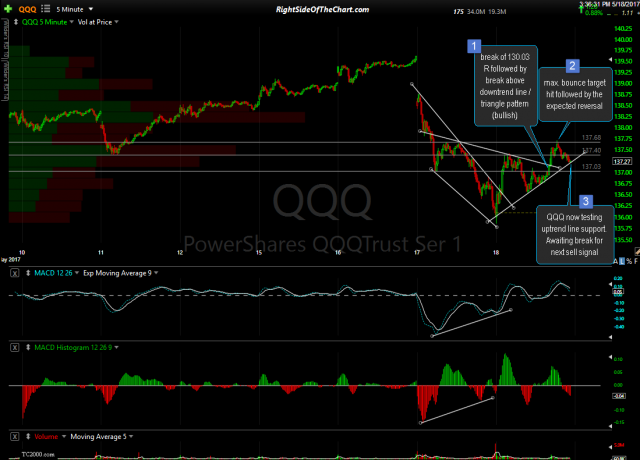
QQQ hit a high of 137.72 so far today which was my upper-bounce target posted on the 5-minute charts earlier today. The second chart below was posted in the trading room as a follow-up to the first 5-minute chart below from today’s earlier front page update on QQQ. The Q’s are likely to experience at least one more reaction off this tag of the uptrend line before it breaks & as mentioned earlier, with OpEx tomorrow, there’s a decent chance that they’ll hold this market up into the weekend.
-
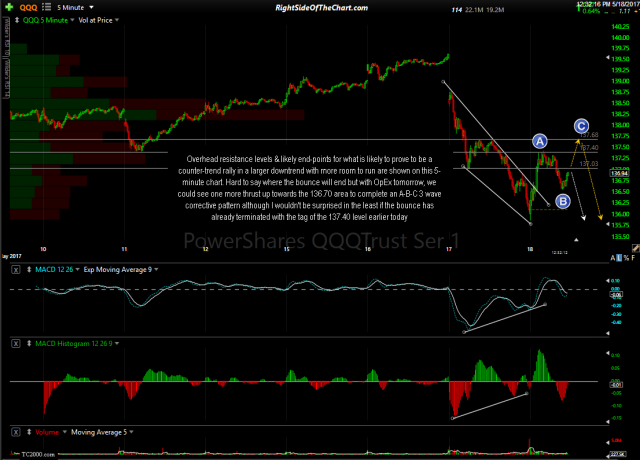
- QQQ 5-minute May 18th
-
- QQQ 5-min 2 May 18th
-
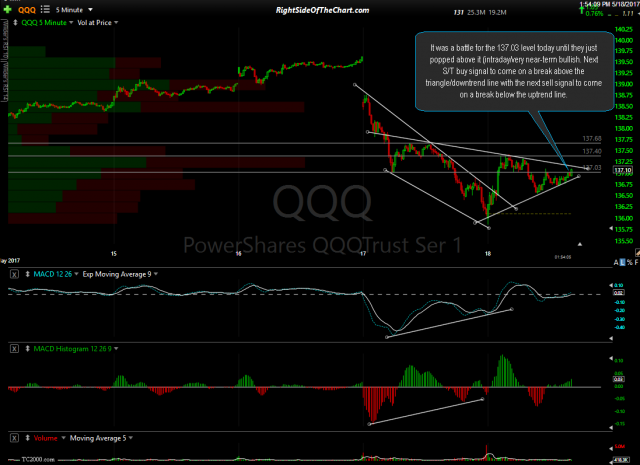
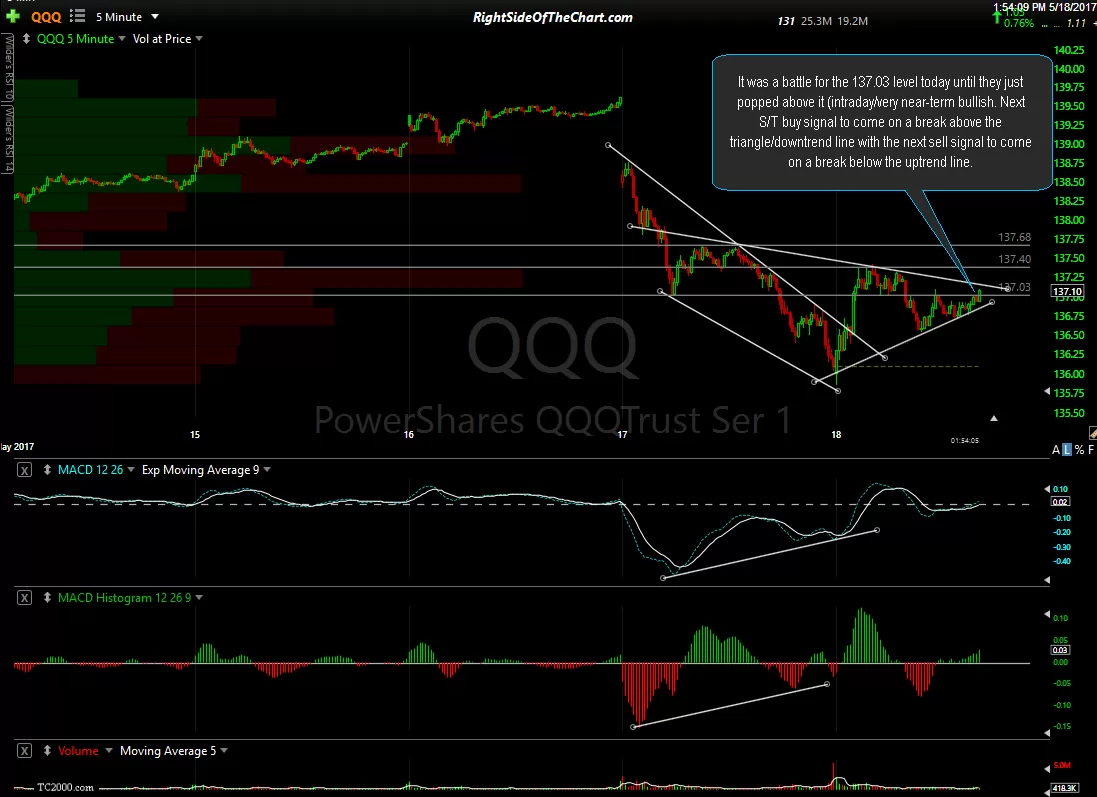
- QQQ 5-min 3 May 18th
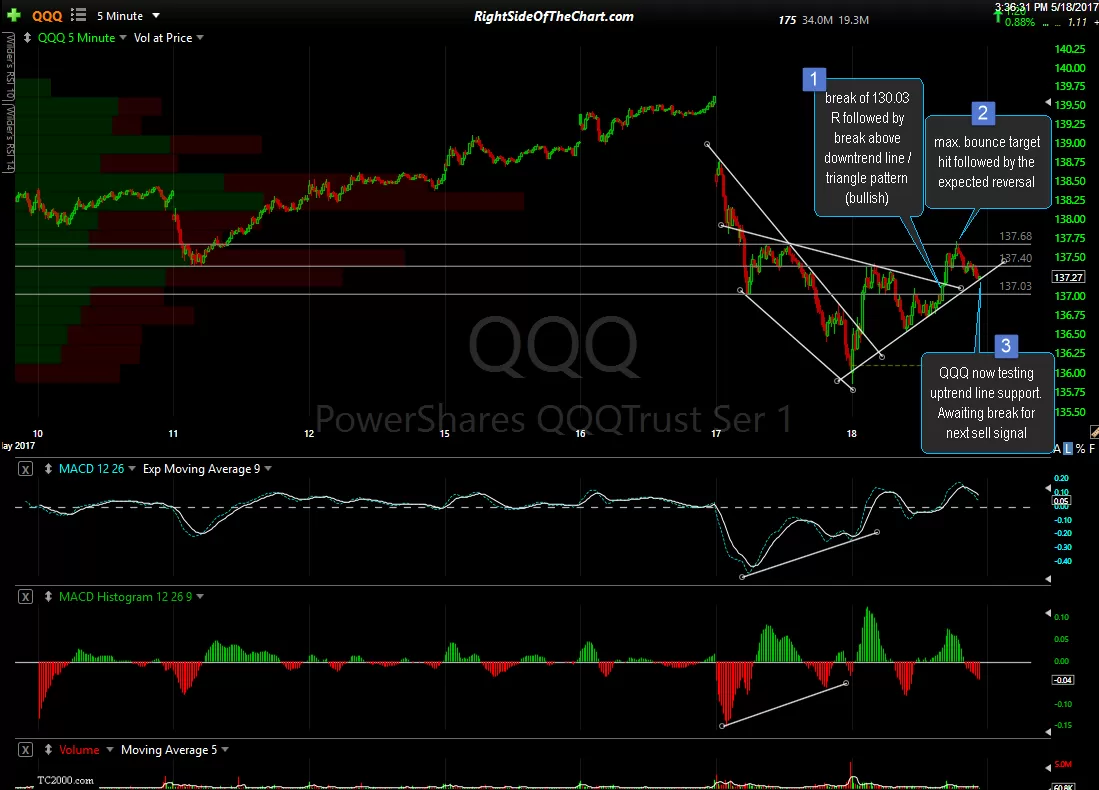
Should the uptrend line get taken out (on a solid 5-minute candle close below, not just a brief dip below), the support levels to watch will be 137.00 & then then today’s low of 135.87. As always the support & resistance levels on the longer time frames (60-minute, daily, etc…) are more significant than those on the shorter intraday time frames, such as these 5-minute charts. It is also preferable to wait for a break of support or resistance to be ‘finalized’ by the candlestick on the time frame of the chart that you are viewing to finalize. e.g.- A break below support on a 60-minute chart has a lower chance of triggering a false sell signal if the 60-minute candle prints a close below it vs. a brief intra-period dip below, the latter of which is fairly common with prices closing back above the support level.
There goes the closing bell as I wrap this up so to be continued tomorrow. Again, I will be out of the office all day tomorrow with limited to no access to email or the website & will follow-up with any questions or chart requests over the weekend.