
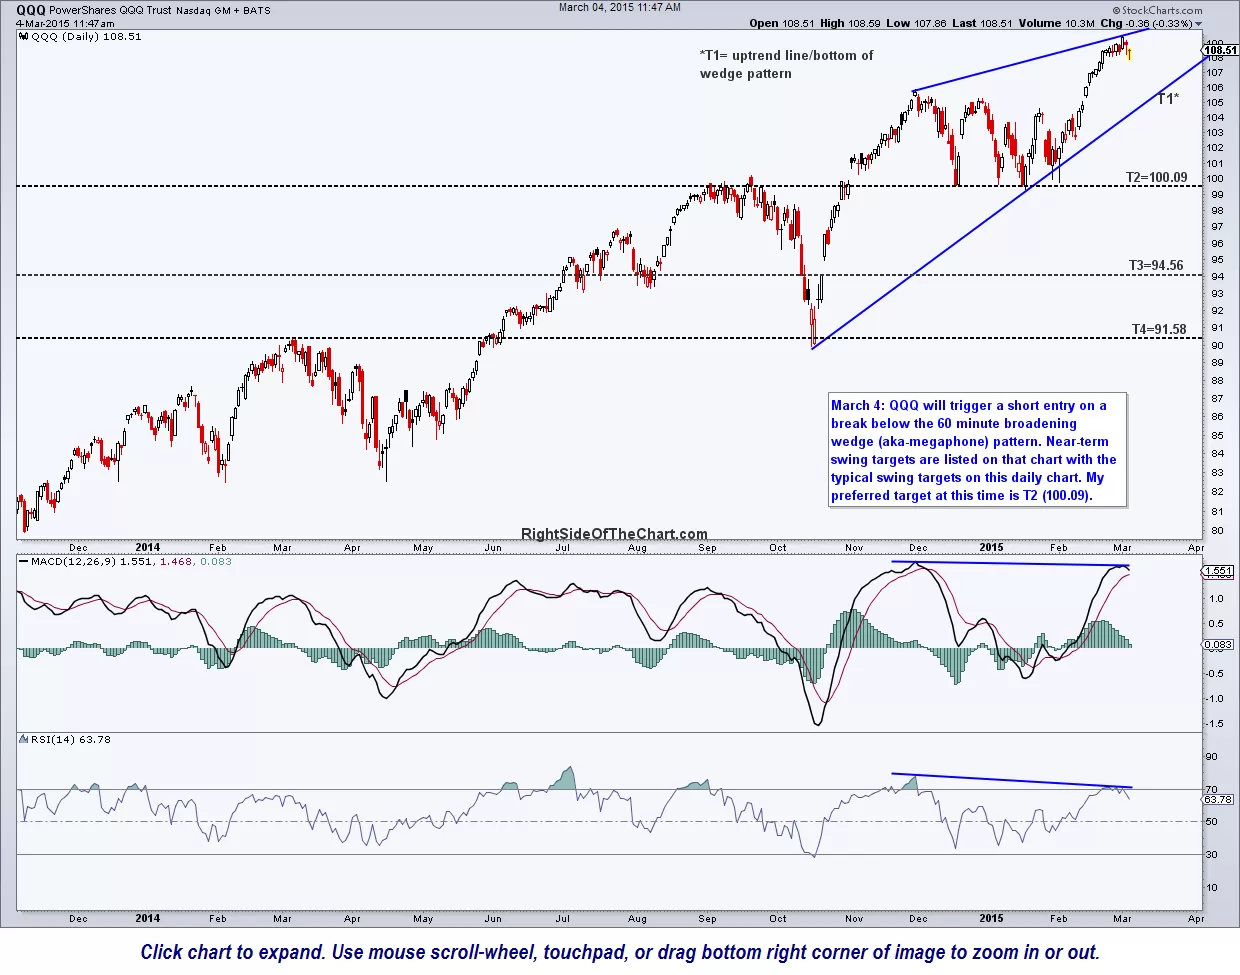
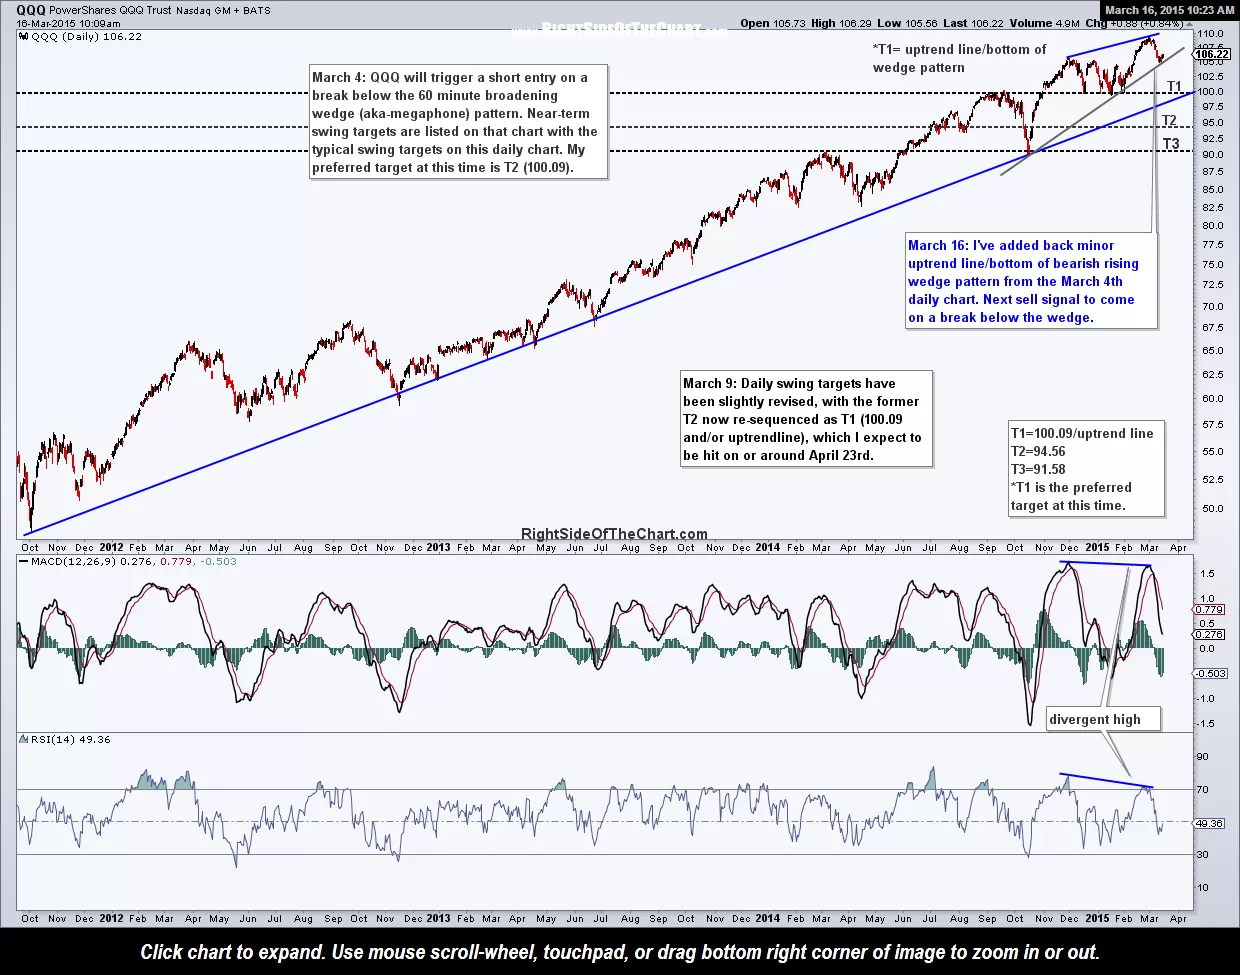
On the updated daily chart below (last chart), I’ve added back the minor uptrend line which defined the bottom of the bearish rising wedge pattern that was listed at the original first target for the swing trade based off the daily chart (2nd chart below). Although I expected more downside today & into this week (the latter which is still likely IMO), QQQ did indeed bounce off the bottom of that wedge which helps to validate that trendline as well as the pattern.
-
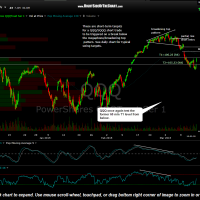
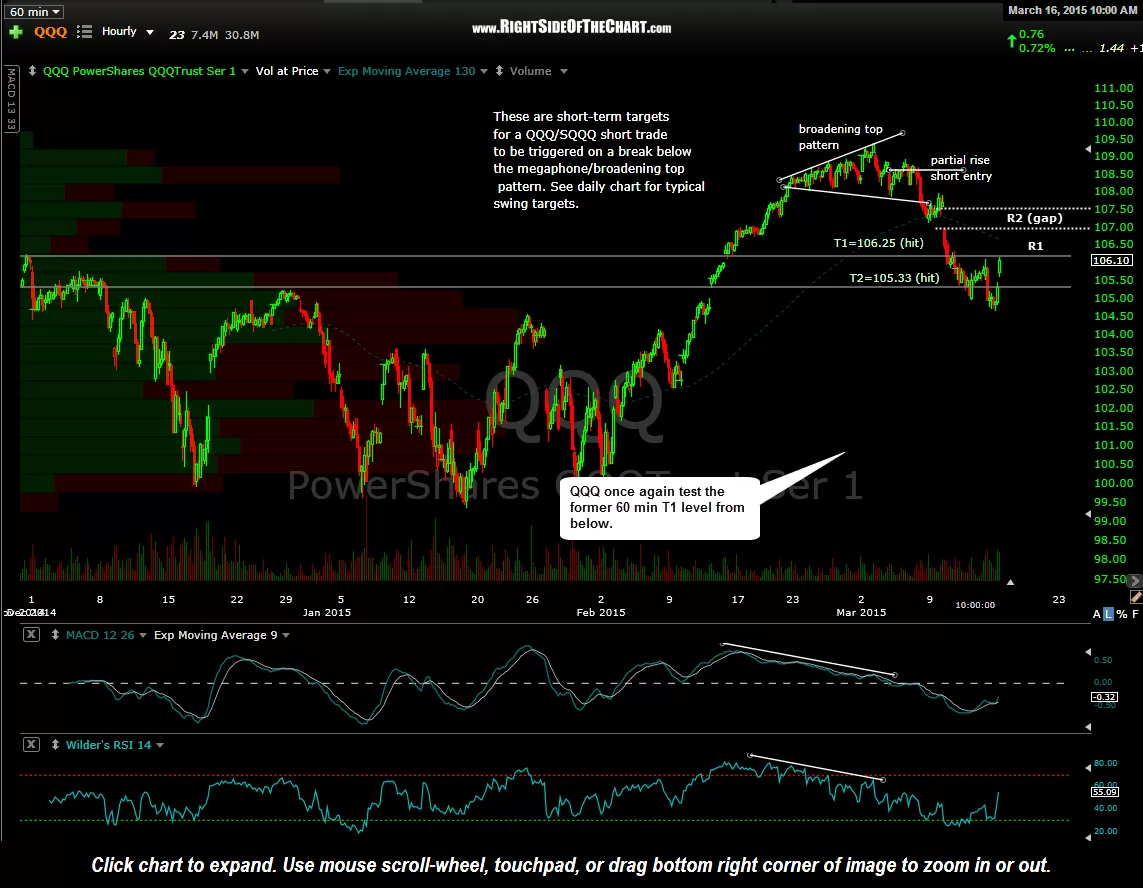
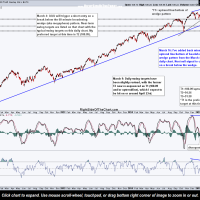
- QQQ 60 min March 16th
-
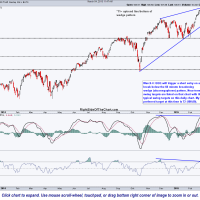
- QQQ daily March 4th
-
- QQQ daily March 16th
Today’s bounce does nothing to change the technical picture on the current swing short position for the Q’s. The first chart below is the updated 60 minute chart listing the first two overhead resistance levels; The former 60 minute T1 level, now labeled R1, followed by the March 10th gap (R2). Note that R2 would come in right around where the lower trendline of the broadening top pattern would extent to, should the QQQ continue to move higher over the next day or so. Therefore, the suggested stop for the QQQ swing trade at this point will be on a 60 minute candlestick close the top of the March 9-10th gap at 107.58.