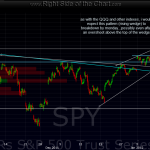
60 minute charts of theSPY and QQQ (S&P500 and Nasdaq 100 tracking etf’s). the SPY is approaching the typical point in a rising wedge patterns where breakdowns usually occur. the Q’s are in a well defined uptrend channel which is also getting a bit long in the tooth. for shorter term traders, a short signal would be triggered on a downside break of these patterns. another possibility that wouldn’t surprise me with the current momentum would be an overshoot of prices above the upper trendlines on these patterns. wedge and channel overshoots often immediately proceed sharp reversals and a break to the opposite side of the pattern/prevailing trend.


