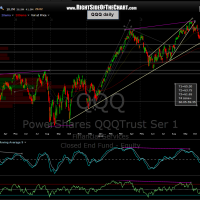
If you recall from my most recent scenario on the QQQ, I have put very close odds that we would continue to move lower (which so far we have) to at least T3 (T3 on both my daily & 4 hour QQQ charts are basically the same, within 10 cents from each other). From there, I have almost equal odds on whether we put in a tradable bounce off T3 or a more muted reaction (temporary pause or bounce) before moving sharply lower to hit T4, which is my final initial swing target. By this, I mean a level where most likely I will likely be reversing my near-term and intermediate bias from short to long.
Keep in mind that although this is, and has been my “master plan” for months now, I am constantly looking for reasons to modify or outright change that plan. If & when that happens, I will try to post my thoughts and supporting evidence asap. Until then, nothing has changed my views on this market but believe me, I am always on the edge of my seat when 100%+ short (the “+” comes from leverage) while the markets are oversold past the point that most would have never even thought possible a few months ago when bullishness was rampant and the markets were making those “bullish” breakouts to new multi-year highs. My point is that that risk for a sudden and sharp reversal starts going up significantly when the markets become this oversold. Therefore, make sure to trade (or not trade) according to your own experience and risk tolerance.
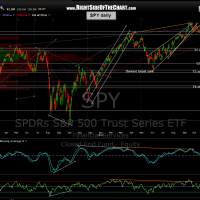
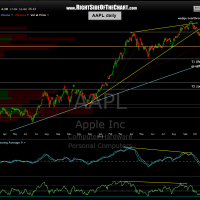
One thing that I did want to share is something that I look for when trading strong trends, whether a bullish uptrend or bearish downtrend. I always make sure to watch as many key sectors and stocks as possible and take in the big picture. Some traders might exclusively trade the SPY or QQQ and as such, are focused only on the key support and resistance level or other technical measure on those charts. From my experience, the best trades (when trying to pick tops, bottoms, or just temporary trend reversals) come when multiple supports on multiple indexes line up. As you can see from the charts below, we are getting very close, and just about at equal distances from key targets that I’ve listed for months now on AAPL, QQQ, and SPY. Therefore, I’d say that the odds are pretty good for a decent (i.e.-tradable) bounce off those targets, especially if they are all hit at once.
Now here’s the tough part: I believe the odds for a sudden powerful sell-off (i.e.-mini melt-down type sell-off such as a 4-5% down day in the broad market) is pretty high right now. That was one of the reasons that I listed almost even odds on my two top scenarios the other day (40% chance we drop to, then bounce off T3 on the QQQ charts, 44% that we slice thru in an impulsive manner and quickly drop to T4). I can’t tell anyone how to trade and to be honest, I’m not sure how much, if any, of my shorts I will cover when these upcoming targets are hit. I will do my best to communicate my thoughts but please remember that I am a trader first and foremost and when the market is moving fast, I have to enter & cancel multiple orders across multiple accounts so I can’t always communicate sudden changes right away.
Hopefully these charts and what I said above will help those of you that have shorted this move down with me to this point or those that might be looking to catch a long-side bounce. Again, be careful and keep things light if you are not experienced in trading bear markets or even strong downtrends such as this. It is a completely different animal than the bull markets that most traders know. Markets almost always fall much faster than they climb and the reversals to the upside can be very fast & powerful as well.


